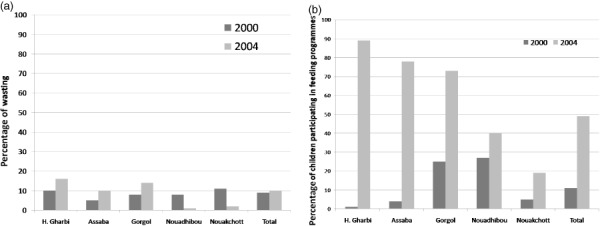
Figure 5.

Changes in wasting compared with participation in child feeding programmes, from baseline, 2000, to end of the project, 2004, by health zone (7). (a) Prevalence of wasting (<−2 height‐for‐age z‐score, age not defined). (b) Percentage of children participating in child feeding programmes.
