
Figure 2.
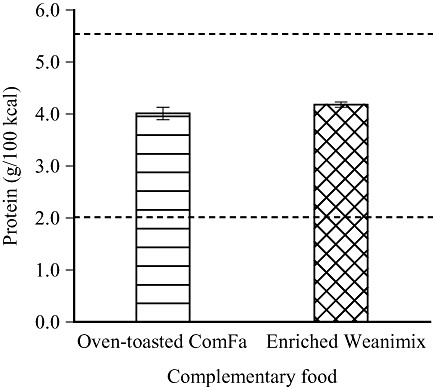
Protein density of household‐level processed complementary foods. Line ( ) represents the minimum and maximum levels for complementary foods for infants in the Codex Standard. Bar values (means ± standard deviation, n = 3).
Official websites use .gov
A
.gov website belongs to an official
government organization in the United States.
Secure .gov websites use HTTPS
A lock (
) or https:// means you've safely
connected to the .gov website. Share sensitive
information only on official, secure websites.
Protein density of household‐level processed complementary foods. Line () represents the minimum and maximum levels for complementary foods for infants in the Codex Standard. Bar values (means ± standard deviation, n = 3).