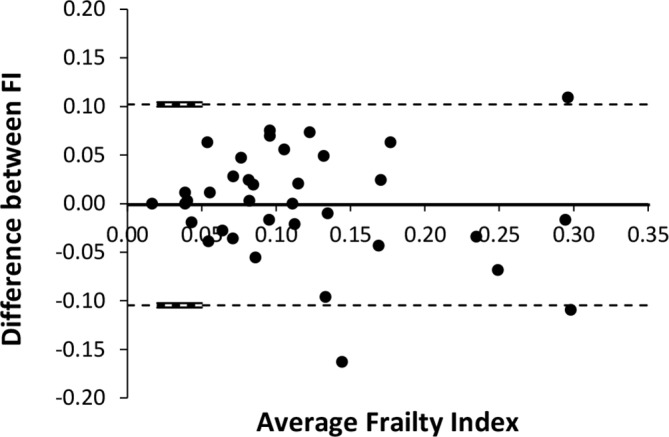
Figure 2.

Bland-Altman (BA) plot of the differences in the Frailty Index (FI) values determined from the nurse–participant and robot–participant data. The solid line in this BA plot shows the mean difference between the two methods. The dashed lines are the limits within which 95% of the values of the difference per individual fall.
