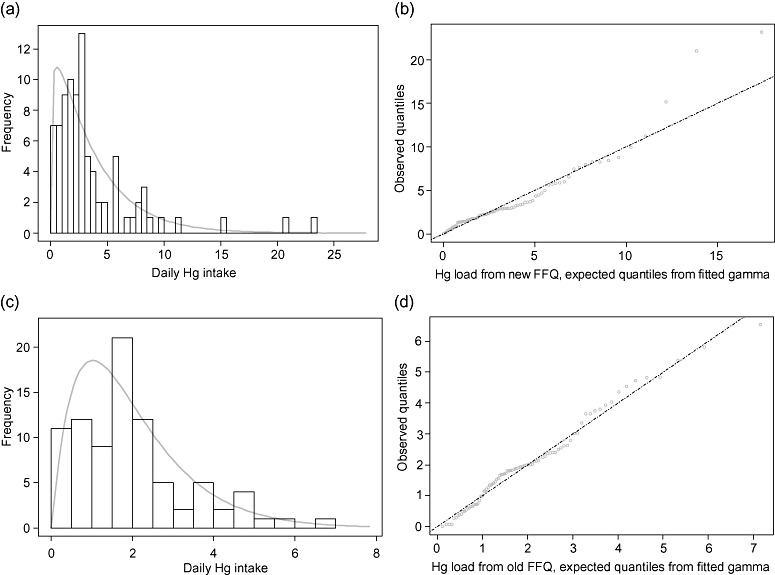
Figure 1.

(a–d) Mercury intakes (μg day−1) calculated from the old and new questionnaires, with gamma distributions fitted by maximum likelihood estimation (n = 86). The fitted distributions are used for computing confidence intervals. (a) Daily Hg intake calculated from the new questionnaire, with gamma distribution fitted. (b) Plot of observed values vs. expected values from the gamma fitted in (a). (c) Daily Hg intake calculated from the old questionnaire, with gamma distribution fitted. (d) Plot of observed values vs. expected values from the gamma fitted in (c).
