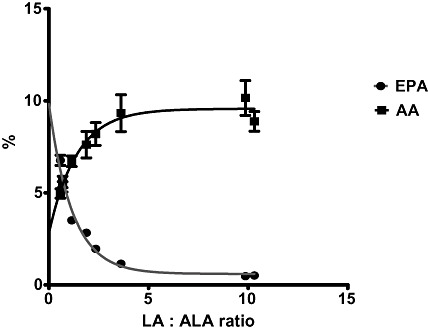
Figure 2.

Results of an experiment illustrating the effect of feeding chickens a range of diets varying in the LA : ALA ratio on the EPA (close circles) and AA (closed squares) content of tissues as a % of total fatty acids. AA, arachidonic acid; ALA, alpha‐linolenic acid; EPA, eicosapentaenoic acid; LA, linoleic acid.
