
Table 1.
Statistical indicators between subjective global assessment and objective assessment
| Indicators | Formulas | Values* |
|---|---|---|
| Sensitivity |

|
88.235 |
| Specificity |

|
45.833 |
| Positive predictive value (PV+) |

|
60.606 |
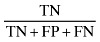
| Negative predictive value (PV‐) |

|
80.487 |
| False positive error rate |

|
54.167 |
| False negative error rate |

|
11.765 |
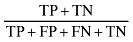
| Accuracy |
|
66.428 |
| Positive Power (Po+) |

|
56.074 |
| Negative Power (Po‐) |
|
41.25 |
| Likelihood ratio positive (LR+) |

|
1.628 |
| Likelihood ratio negative (LR‐) |

|
0.256 |
| Odds ratio (OR) |

|
6.359 |
*
Values are presented as percentage (%) except for LR+, LR‐ and Odds ratio.