
Figure 1.
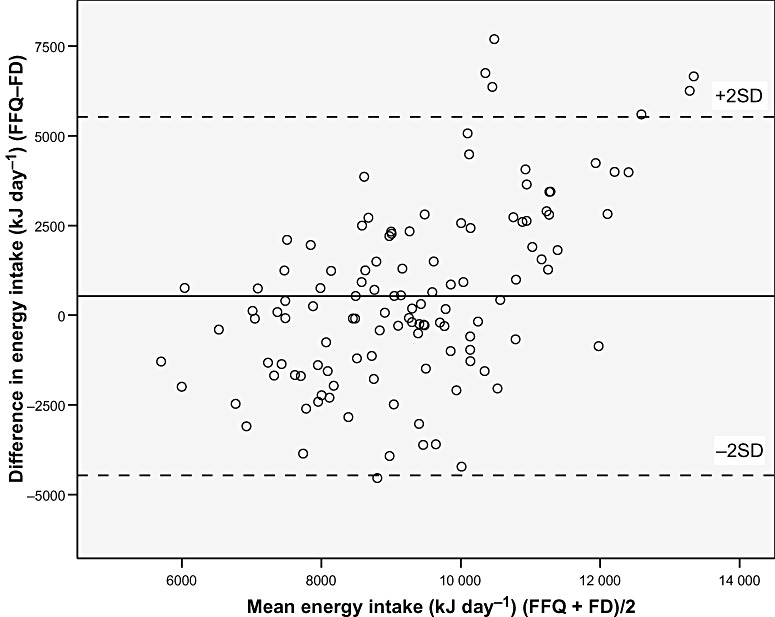
Bland–Altman plot between the food frequency questionnaire (FFQ) and the food diary (FD) methods for measuring daily energy intake. The solid line represents the mean difference between the two methods, and the dashed lines represent the limits of agreement corresponding to ±2 (SD).