
Figure 2: Sensitivity analysis with three different prior estimates of α′s in scenarios 1–4.
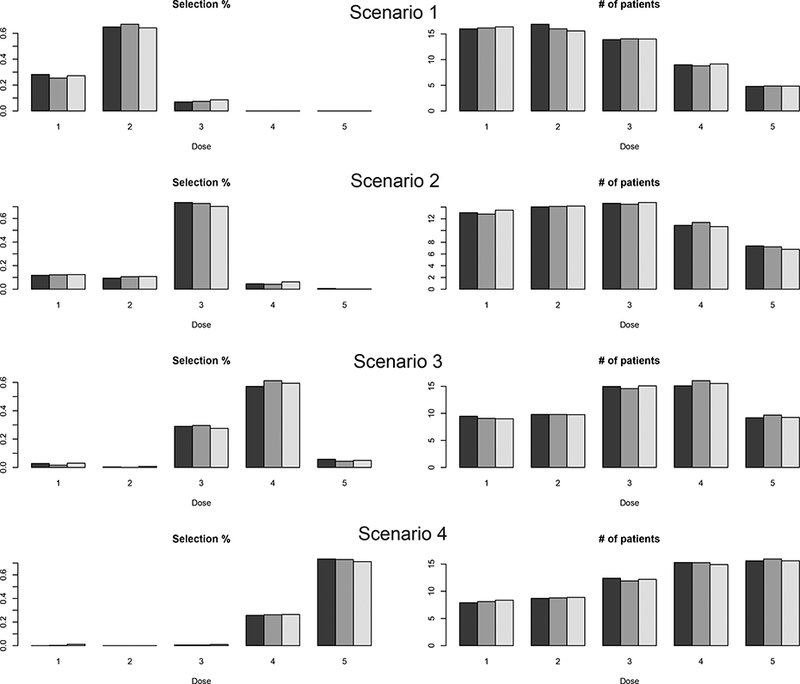
In each plot, at each dose level, the three bars from left to right correspond to the results with prior estimates = ( 1, 5, 0.5, 2), (2, 4, 0.4, 3), and (1.5, 6, 0.6, 2.5), respectively.