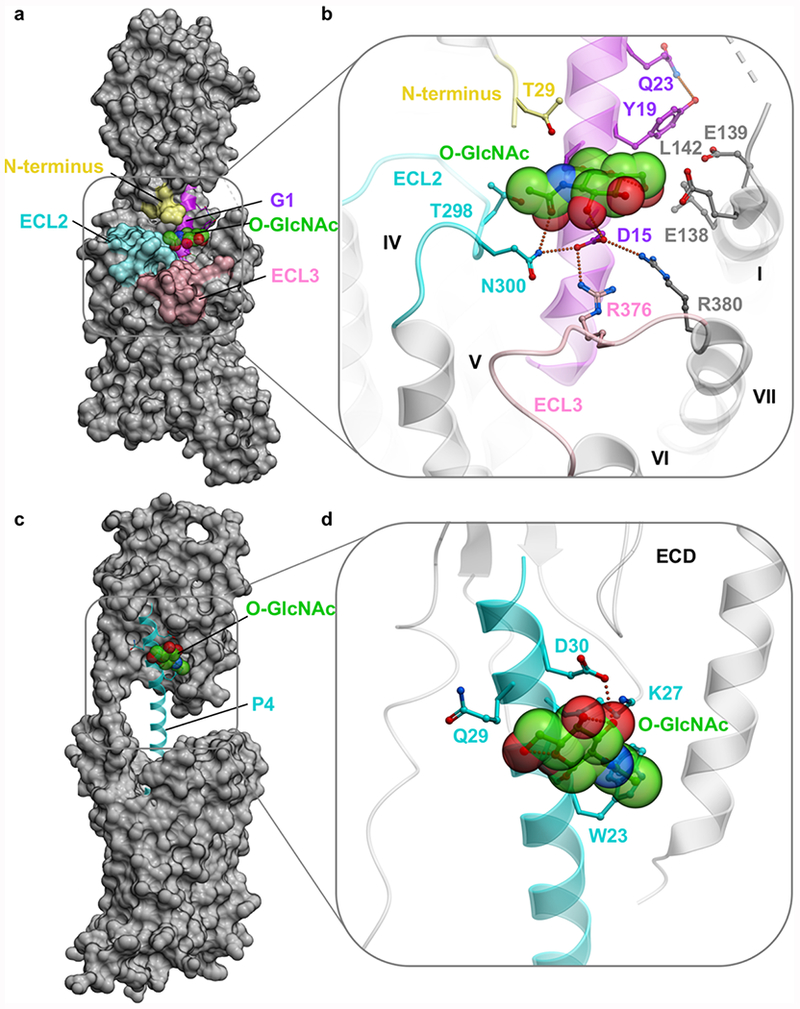
Figure 5.

Models of full length GLP-1R-G1 and PTH1R-P2 complexes. (a) Overview of the G1-GLP-1R represented as a molecular surface. (b) Close up showing predicted stabilizing interactions of the O-GlcNAc moiety. In both panels, GLP-1R is shown as gray, except for ECL2 (cyan), ECL3 (pink), and truncated N-terminus (yellow). G1 peptide is represented as a ribbon (magenta), where the O-GlcNAc moiety is highlighted as transparent spheres with carbon atoms colored green. Predicted intermolecular hydrogen bonds and salt bridges are shown by green dotted lines. (c) Overview of the P4-PTH1R represented as a molecular surface. (d) Close up showing predicted stabilizing interactions of the O-GlcNAc moiety. In both panels, PTH1R is shown as gray. P4 peptide is represented as ribbon (cyan), where the O-GlcNAc moiety is highlighted as transparent spheres with carbon atoms colored green.
