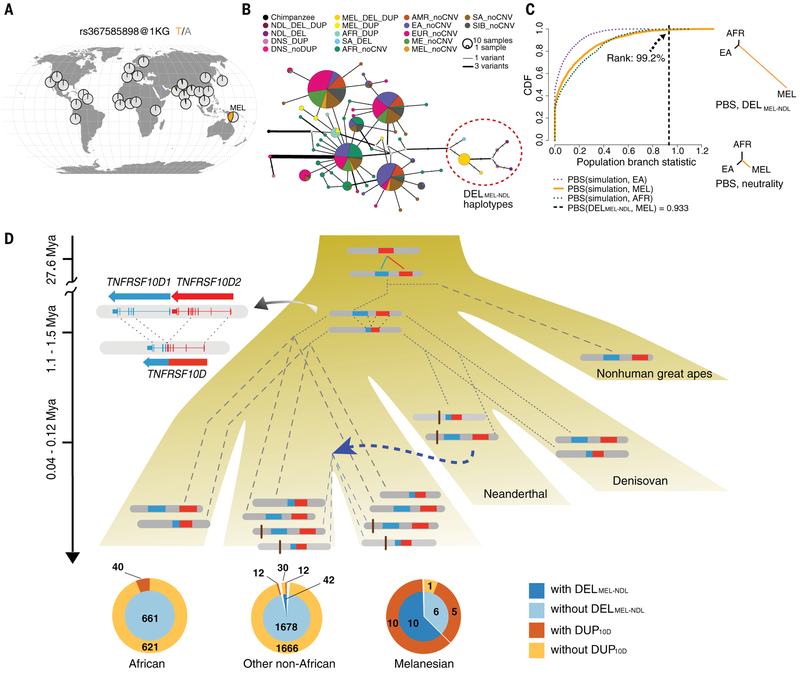
Fig. 5. Complex evolutionary history and evidence of adaptive archaic introgression at 8p21.3 in Melanesians.
(A) Geographic distribution of the DELMEL-NDL tag SNV, rs367585898, using the 1KG data. (B) Median-joint network showing that all deletion-linked haplotypes form a single clade. Colors represent different haplotypes (DEL and DUP refer to DELMEL-NDL and DUP10D, respectively). Edge width indicates the number of pairwise differences between the joined haplotypes. (C) A highly unusual PBS of DELMEL-NDL in the Melanesians, compared with those computed using variants with similar age in neutral coalescent simulations, supports the hypothesis of positive selection favoring this introgressed variant. CDF, cumulative distribution function. (D) (Top) Schematic model for the evolution of the DELMEL-NDL and DUP10D variants among great ape lineages. Dashed and dotted lines correspond to contemporary and historical lineages, respectively. (Bottom) Pie charts show the numbers of individuals from the 1KG and SGDP panels with or without the two CNVs.

