Figure 5.
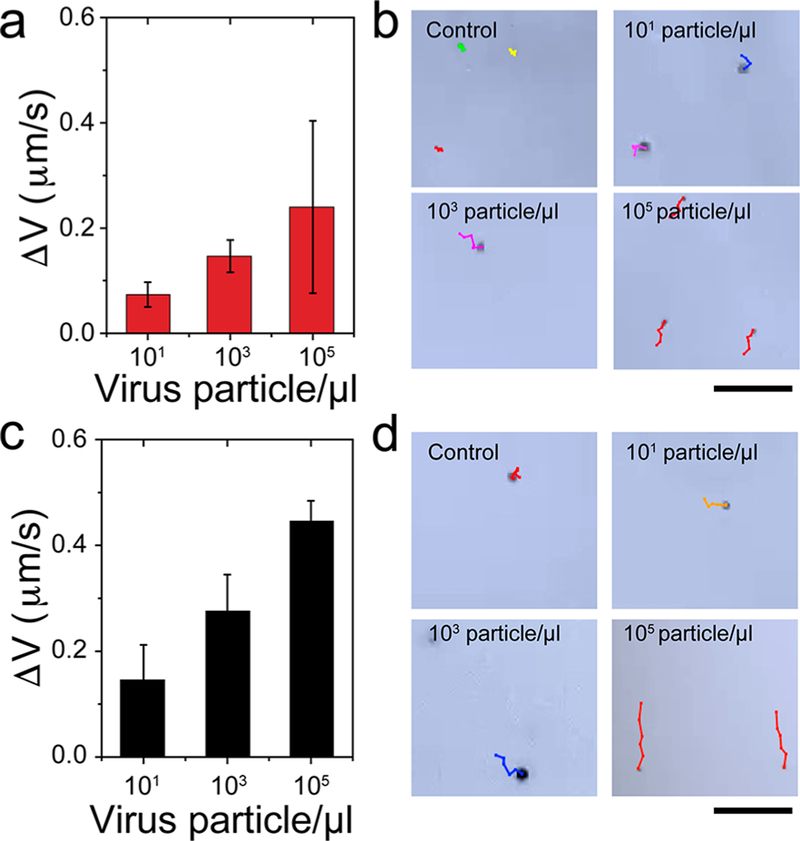
ZIKV detection in biological samples using the NBC system. (a) Detection of ZIKV spiked in urine samples with virus concentrations of 101 particles/μL, 103 particles/μL, and 105 particles/μL. (b) Trajectory images of beads motion recorded for ZIKV-spiked urine samples. (c) Detection of ZIKV-spiked saliva samples with virus concentrations of 101 particles/μL, 103 particles/μL, and 105 particles/μL. (d) Trajectory images of beads motion recorded for ZIKV-spiked urine samples. Error bars are standard deviations from a total of three independent measurements.

