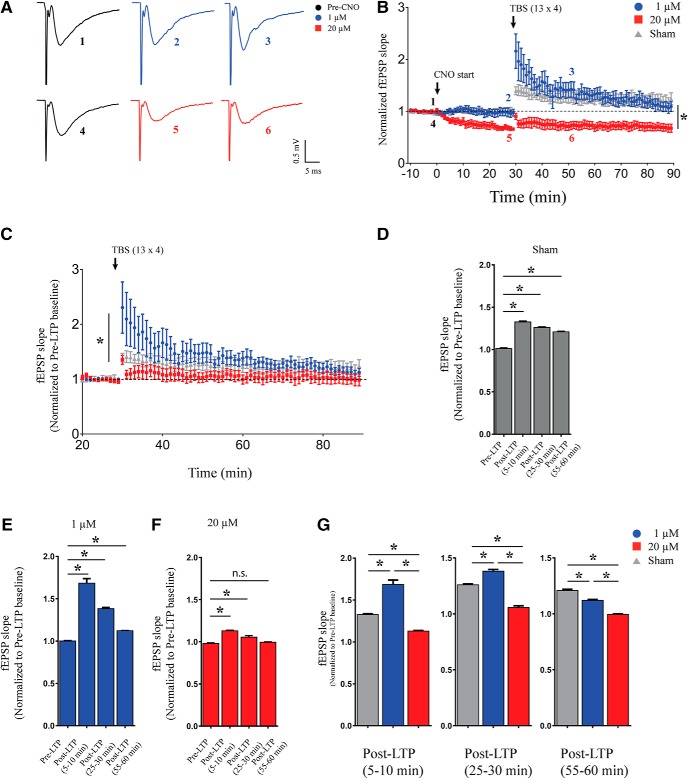
Figure 3.
Dose-dependent effects of acute chemogenetic hM3Dq activation on TBS-induced LTP in hippocampal slices. A, Shown are representative fESPS traces before, 30 min after CNO treatment and 20 min after LTP induction. B, Slices with 30 min of 1 μM CNO bath application or sham-administered control, show robust induction in LTP, with failure to induce LTP at 20 μM CNO treatment. Bath application of 1 μM CNO results in a significant increase in early-phase LTP as compared to sham-treated controls. C, fEPSP slope normalized to pre-LTP baseline shows robust potentiation with bath application of both sham and 1 μM CNO, but not at 20 μM CNO; *p < 0.05 as compared between 1 and 20 μM CNO treatment (linear regression followed by ANCOVA) for time-course analysis. The average fEPSP slope in 5-min time bins is significantly increased in 5- to 10-, 25- to 30-, and 55- to 60-min bins as compared to pre-LTP in aCSF bath (sham; D) as well as with 1 μM CNO bath application (E). The average fEPSP slope in 5-min time bins was significantly increased 5- to 10- and 25- to 30-min bins as compared to pre-LTP with 20 μM CNO bath application (F). The average fEPSP slope was not significantly different in 55- to 60-min bin as compared to pre-LTP with 20 μM CNO bath application (F). Results are expressed as the mean ± SEM; *p < 0.05 as compared between pre-LTP and post-LTP (5–10 min), post-LTP (25–30 min), or post-LTP (55–60 min; one-way ANOVA followed by post hoc Bonferroni multiple comparison). G, The average fEPSP slope in 5-min time bins is significantly increased in 5- to 10 and 25- to 30-min bins as compared to pre-LTP with 1 μM CNO bath application. The average fEPSP slope with 20 μM CNO bath application in 5- to 10- and 25- to 30-min bins was significantly lower compared to both sham-treated control and 1 μM CNO treatment. The average fEPSP slope in the 55- to 60-min bin was significantly lower with both 1 and 20 μM CNO bath application compared to sham-treated control. Results are expressed as the mean ± SEM; *p < 0.05 as compared between sham, 1 μM, and 20 μM CNO treatment for each time bin (one-way ANOVA followed by post hoc Bonferroni multiple comparison).

