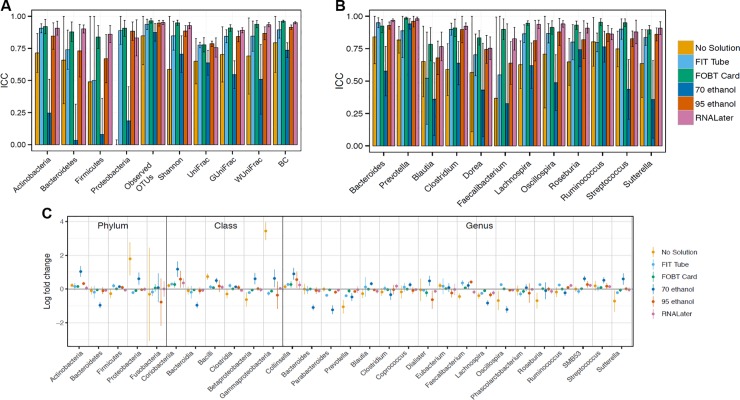
Fig 3. Meta-analyzed ICCs and log-fold changes based on random effects models for microbiome stability comparing fecal samples frozen on day-4/7 to those frozen at day-0 for six fecal sample collection methods among 132 participants in five studies (Mayo 1-Knight lab, Mayo 1-Mayo lab, Mayo 2, Bangladesh, and Colorado).
ICCs are based on ten microbial composition metrics (panel A; square root transformed abundance of four phyla, two alpha diversity metrics [number of observed OTUs and Shannon index] and four beta diversity metrics [unweighted UniFrac, generalized UniFrac, weighted UniFrac, and Bray-Curtis distance]), and select square root transformed bacterial genera (panel B) with prevalence in the population >80% and a mean relative abundance >0.2%. Log-fold changes in relative abundance from day-0 (panel C) are based on select taxa with prevalence > 50% and a mean read count > 10. All error bars represent 95% CIs. Abbreviations: BC, Bray-Curtis distance; FIT, fecal immunochemical tests tubes; FOBT, fecal occult blood test cards; FTA, Flinders Technology Associates cards; GUniFrac, generalized UniFrac distance; ICC, intraclass correlation coefficient; UniFrac, unweighted UniFrac distance; WUnifrac, weighted UniFrac distance.

