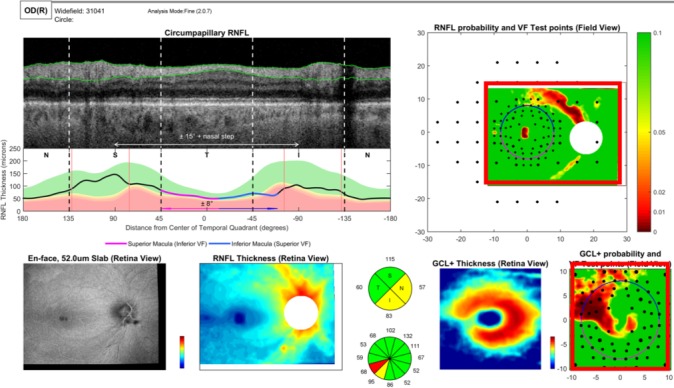
Figure 1.

The report based upon a wide-field swept-source OCT volume scan (see text and Hood et al.10 and Wu et al.11). The RFNL (upper right, red rectangle) and RGC+ (lower right, red rectangle) probability maps are shown in field view (i.e., the top of each corresponds to the upper visual field/inferior retina).
