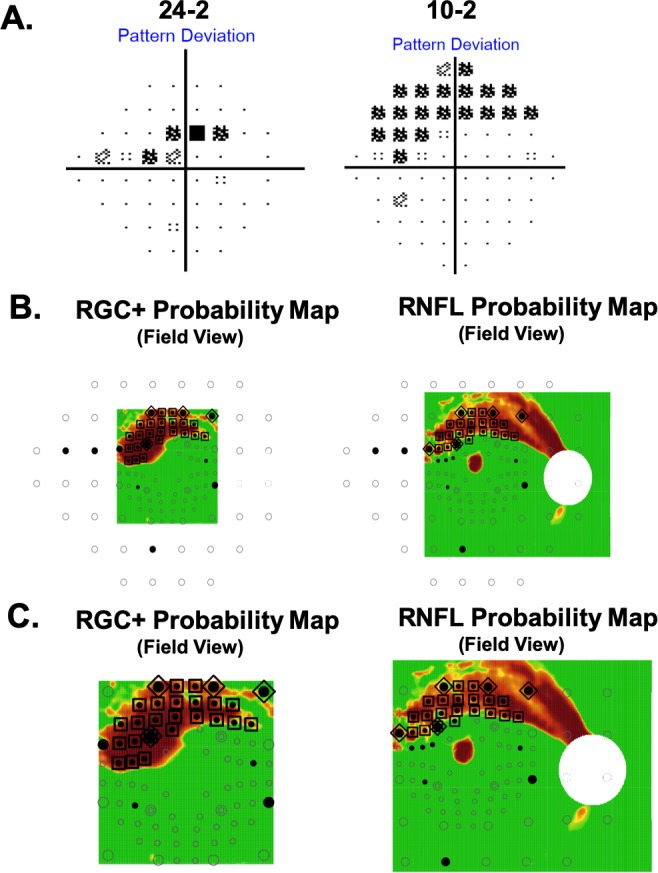
Figure 2.

An eye with aS-aF agreement for both 24-2 and 10-2 VF locations on both RNFL and RGC+ layer probability maps. (A) The 24-2 and 10-2 VF for one of the eyes with early glaucoma. (B) RGC+ and RNFL probability plots shown with all the test locations of the 24-2 (larger circles) and 10-2 (smaller circles) VF. (C) An enlarged view of the portion of the maps in (B) covered by the OCT wide-field scan. The black filled circles are the VF locations significant at <5%. The probability scale for the OCT map varies continuously from green (P > 0.1) to dark red (P < 0.001). The locations enclosed in the large symbols indicate aS (<10%)–aF (<5%) agreement for the 24-2 (triangles) and 10-2 (squares) locations.
