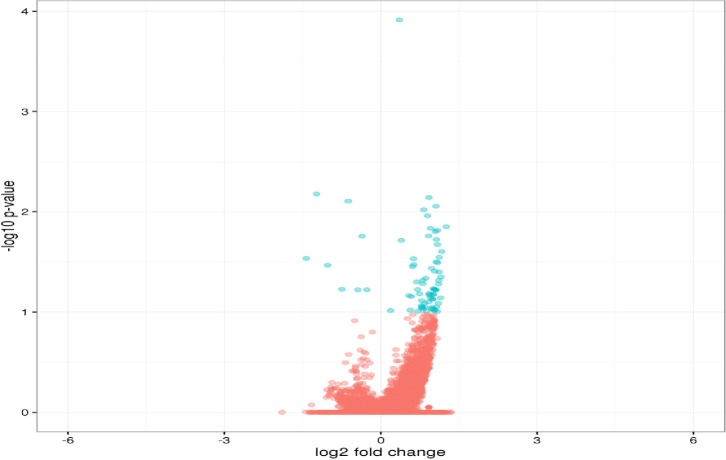
Fig 5. Volcano plot of expressed transcripts as determined by RSEM/EBseq.
Blue dots indicate significantly higher expressed genes in pansteatitis as compared to healthy adipose tissues. Blue dots to the right side of zero on the x axis indicate the upregulated genes while those on the right show the downregulated genes.

