Figure 4. Detection of dynamic range of transcript levels using MAGIC.
(A) Undifferentiated hPSCs, differentiating hPSCs at day 5 of cardiac differentiation as well as differentiated cardiac myocytes at days 8 and 20 of differentiation were fixed and stained with smFISH probes against the MHCα mRNA. Normalized smFISH/cell is plotted and shows an increase of transcript levels as cellular differentiation of hPSCs proceeds (n = 164 cells). (B) Living undifferentiated hPSCs, differentiating hPSCs at day 5 of cardiac differentiation as well as differentiated cardiac myocytes at days 8 and 20 of differentiation were transfected with MAGIC Factor and MAGIC Probe against the MHCα mRNA. Single living cells were assessed for FRET by confocal microscopy and the FRET images were corrected for spectral bleed-through from both donor and acceptor. The resulting FRET image is shown in pseudocolor-coding. Normalized FRET/cell is plotted and shows an increase of transcript levels as cellular differentiation of hPSCs proceeds, demonstrating that MAGIC is able to detect a dynamic range of transcript levels (n = 65 cells). (C) hPSC-CMs were subjected to simultaneous smFISH and MAGIC of the MHCα (top panel) and MLC2a (bottom panel) mRNA. smFISH/cell and FRET/cell are plotted and show a robust positive correlation between both assays. Each point represents a single cell. From the smFISH and FRET images, the degree of co-localization was quantified (Manders’ Overlap Coefficient, MOC). The cells were assessed by confocal microscopy and the FRET images corrected for spectral bleed-through from both donor and acceptor. The resulting FRET image is shown in pseudocolor-coding. n ≥ 45 single cells per group. Note that thresholded pixels are excluded from FRET images and thus appear as black signals. Further details on post-image processing are included in the Materials and methods. Scale bars 25 μm (A,B) and 20 μm (C). Quantified data are shown as mean ± s.e.m.
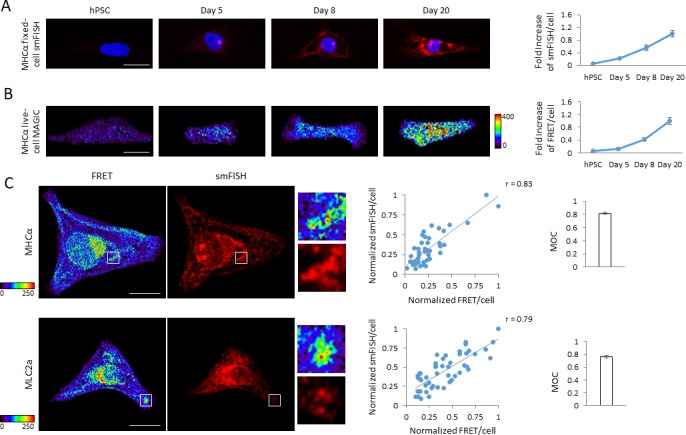
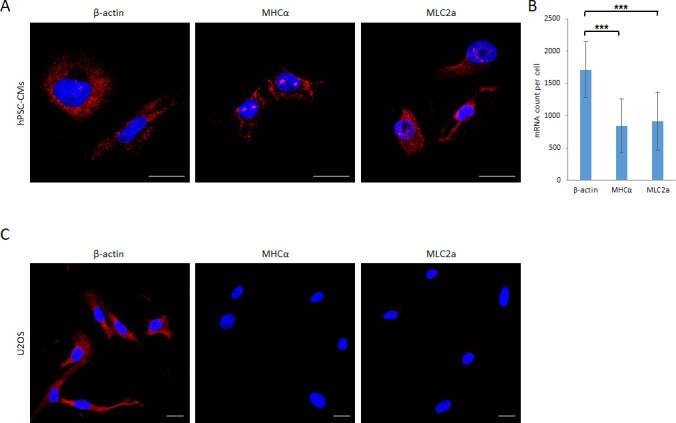
Figure 4—figure supplement 1. smFISH imaging of β-actin, MHCα and MLC2a mRNA in hPSC-CMs and U2OS cells.