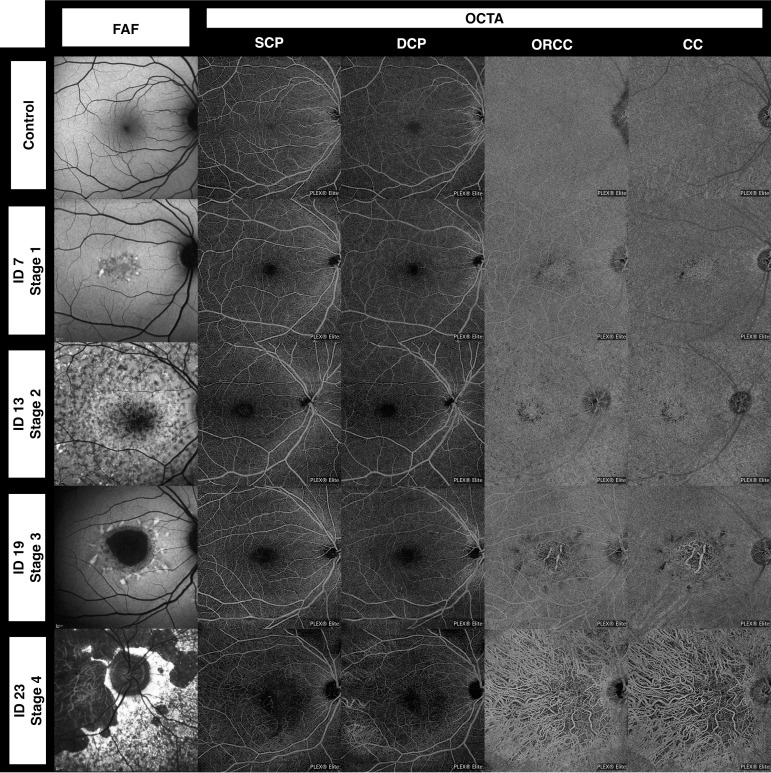
Figure 2.
Optical coherence tomography angiography (OCTA) and fundus autofluorescence (FAF) imaging in a control patient (upper row) and four different stages of Stargardt disease based on the Fishman classification. For detailed information on these four patients, see table 1. CC, choriocapillaris; DCP, deep capillary plexus; ORCC, outer retina to choriocapillaris; SCP, superficial capillary plexus.

