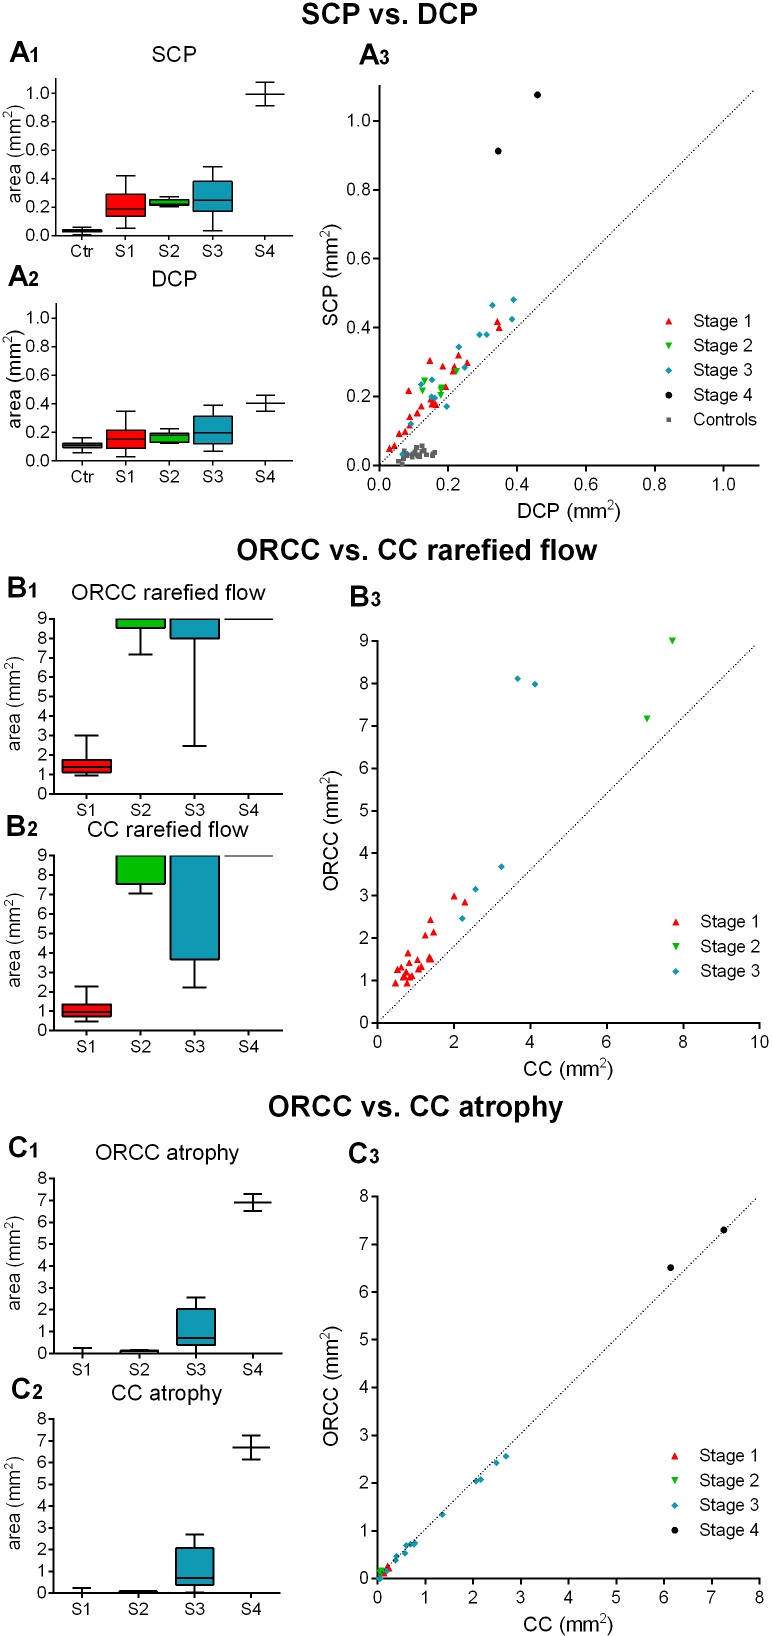
Figure 4.
Quantitative evaluation of vascular alterations in Stargardt disease (STGD). Box and whiskers plot demonstrating the area of vascular alterations (in mm2) of patients in different stages of STGD (S1–S4) and controls (Ctr). Data on the foveal avascular zone in the superficial and deep capillary plexuses (SCP and DCP) are depicted in A1–A3, data on the area of rarefication of flow signal/atrophy in the outer retina to choriocapillaris (ORCC) layer and choriocapillaris (CC) are shown in B1–B3 and C1–C3, respectively. To assess any correlation between the areas of rarefied flow in the ORCC compared with the CC layer, we excluded data of 17 eyes as the area of rarefied flow exceeded the maximum available image size of 9×9 mm2. A linear mixed model, using the diagnosis and stage of disease as a fixed factor and the patient ID as a random factor, also including signal strength values for each image, was used to analyse differences between the groups. All analyses (A1, A2, B1, B2, C1, C2) show a significance value of p<0.01.

