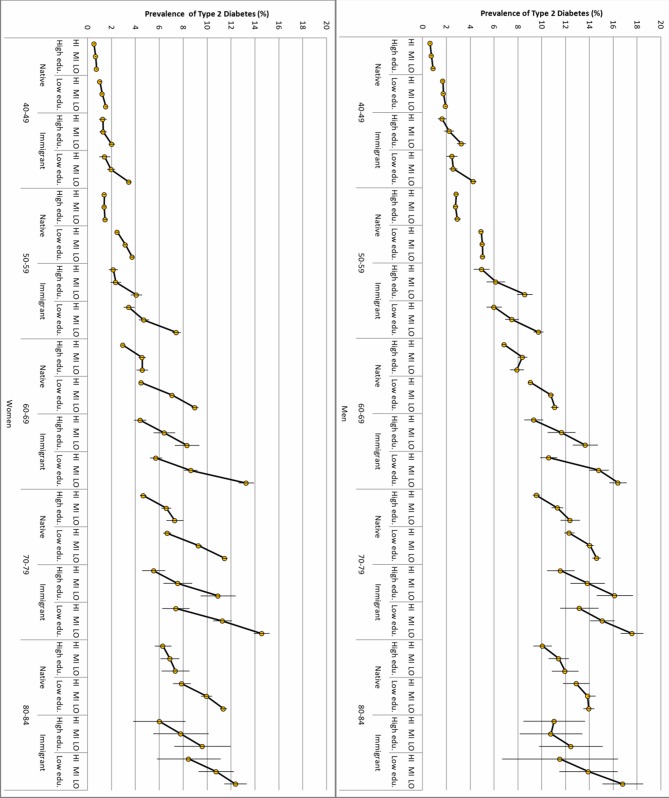
Figure 3.
Prevalence (absolute risk) of type 2 diabetes (T2D) in men and women by multicategorical strata defined by age, gender, immigration status, educational achievement, and high (HI), medium (MI), and low (LO) income levels. The association between income and T2D risk is illustrated by thick black lines with yellow circles crossed by the lines representing 99% CIs.

