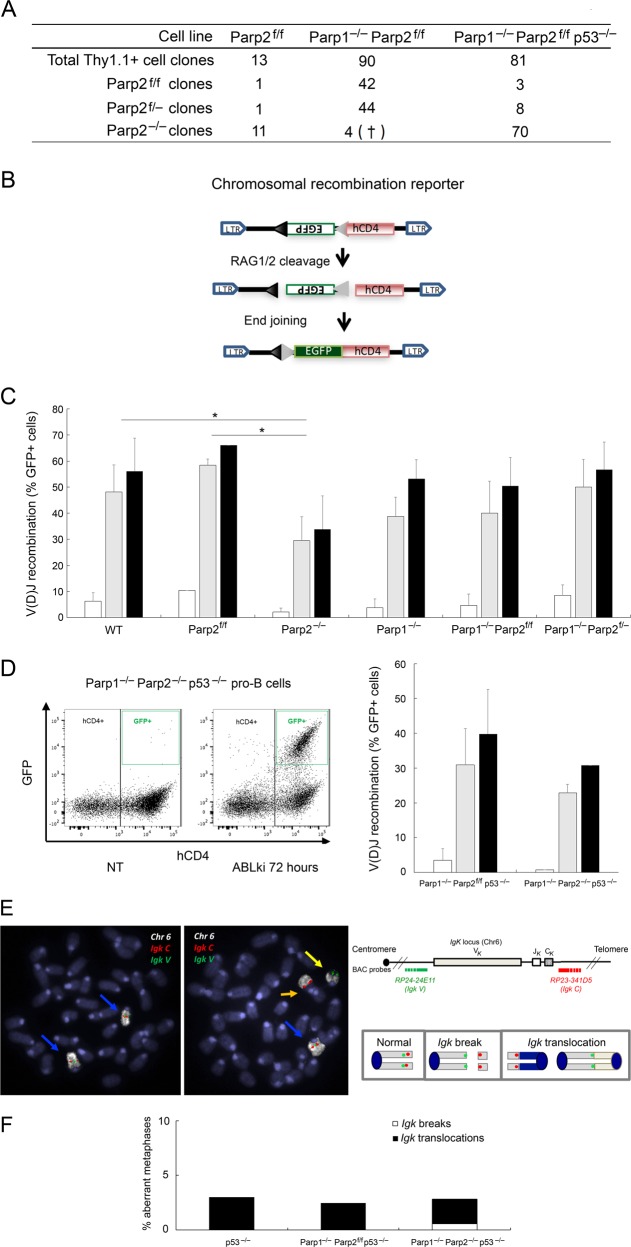
Fig. 3.
PARP1 and PARP2 are dispensable for V(D)J recombination. a Parp2 genotyping of v-abl pro-B-cell clones after pMSCV-CRE-IRES-Thy1.1 infection and single cell sorting. Number of cell clones genotyped is indicated. See also Fig. S3. † indicates that the clone died during cell expansion. b Schematic of pMX-INV recombination substrate. The 12-recombination signal sequence (RSS-12; black triangle), GFP cDNA, 23-recombination signal sequence (RSS-23; gray triangle), IRES - human CD4 cDNA (hCD4) and LTRs are indicated. c, d pMX-INV v-abl pro-B-cell lines untreated (white bars) or treated for 72 h (gray bars) and 96 h (black bars) with ABLki were assayed for pMX-INV rearrangement by flow cytometry, with the percentage of GFP expressing cells among total hCD4 positive cells indicated. Data represent the means ± SEMs of at least two independent experiments using wild type (WT), Parp2f/f, Parp2−/−, Parp1−/−, Parp1−/− Parp2f/f, Parp1−/− Parp2f/−, Parp1−/− Parp2f/f p53−/− and Parp1−/− Parp2−/− p53−/− cell lines described in Table S2. *P < 0.05. d, left panel Representative FACS plots of pMX-INV rearrangement before treatment (not treated, NT) and after 72 h of ABLki treatment (ABLki). e, f Genomic instability at the Igk locus in v-abl pro-B-cell lines. e Schematics of the Igk locus and chromosome 6, with positions of the BACs used for generation of DNA-FISH probes indicated. Representative metaphases from Parp1−/− Parp2−/− p53−/− v-abl pro-B-cells using the Igk C BAC probe (red) combined with Igk V BAC probe (green) and chromosome 6 paint (white). Blue arrowheads point to normal chromosome 6, yellow arrowhead point to broken and orange arrowhead to translocated chromosome 6. f Percentage of aberrant metaphases from v-abl pro-B-cell lines of the indicated genotype harboring chromosomes breaks (white) or translocations (black) involving the Igk locus. (See also Table S4)

