Figure 1.
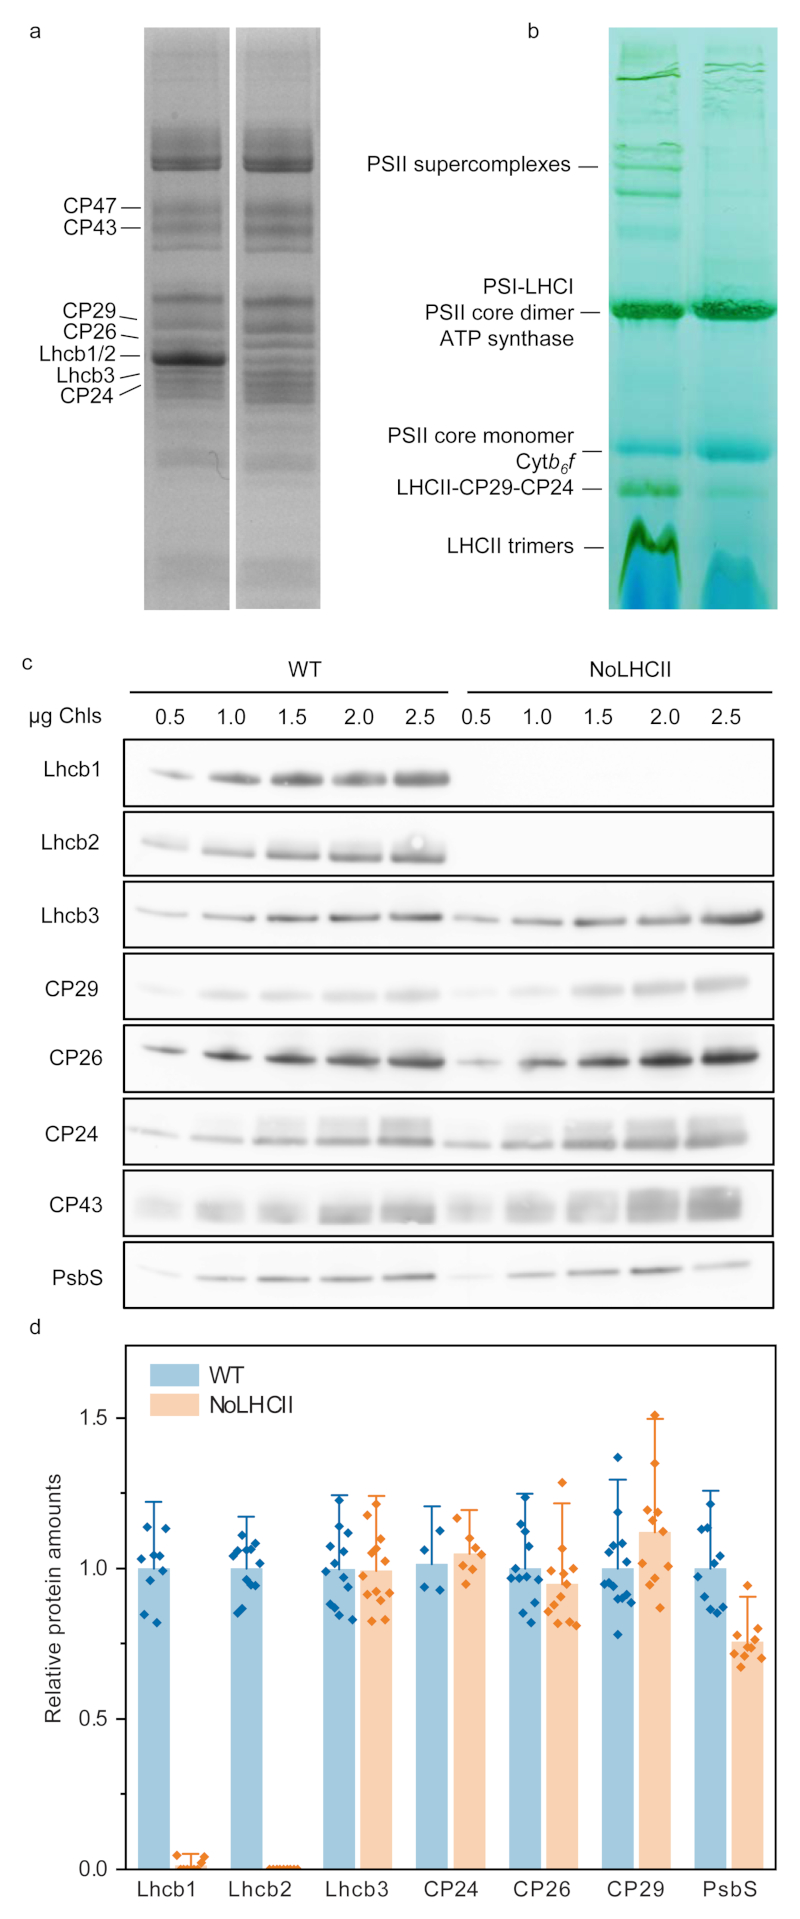
Biochemical characterization of NoLHCII. (a) Coomassie-stained SDS-PAGE of WT and NoLHCII thylakoids. (b) BN-Page of WT and NoLHCII thylakoid membranes solubilized with 1% α-DM. (c) Immunoblots of WT and NoLHCII PSII antenna proteins. Thylakoids were loaded onto the SDS-Page gel in increasing amounts of Chl content to check for signal linearity. Non-linear signals were excluded from the analysis. (a-c) Experiments were repeated independently three times with similar results. (d) Results of immunoblot analysis. Signal intensity was normalized to the corresponding WT signal and to the quantity of PSII core (CP43). The bar graph shows the mean + s.d. Each individual data point is overlayed.

