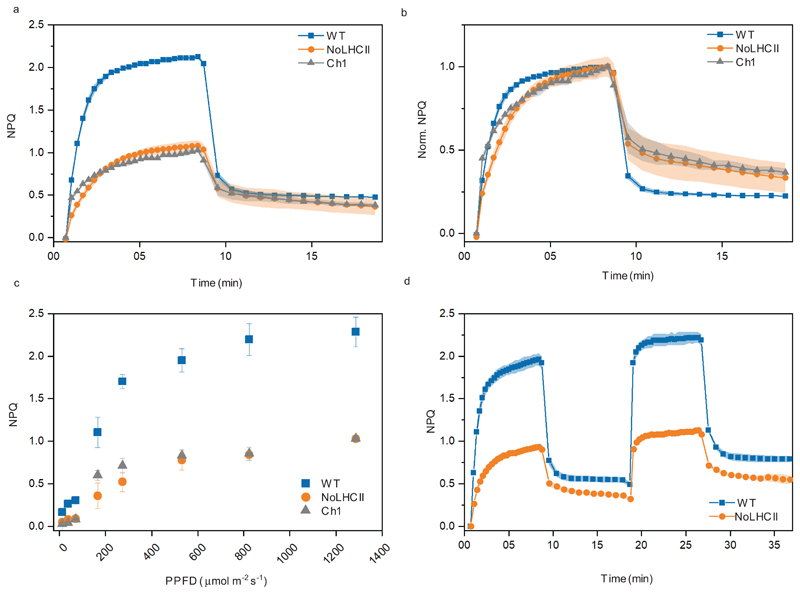
Figure 5.
NPQ characteristics of WT, NoLHCII and Ch1 plants. (a) NPQ kinetics when illuminated with 1287 μmol photons m−2 s−1. (b) Normalised NPQ kinetics. (c) Steady-state NPQ levels measured in a range of actinic light intensities. (d) NPQ kinetics with two periods of light induction, both at 1287 μmol photons m−2 s−1. (a-d) The data represent the mean ± s.d (n = 3 biologically independent experiments).

