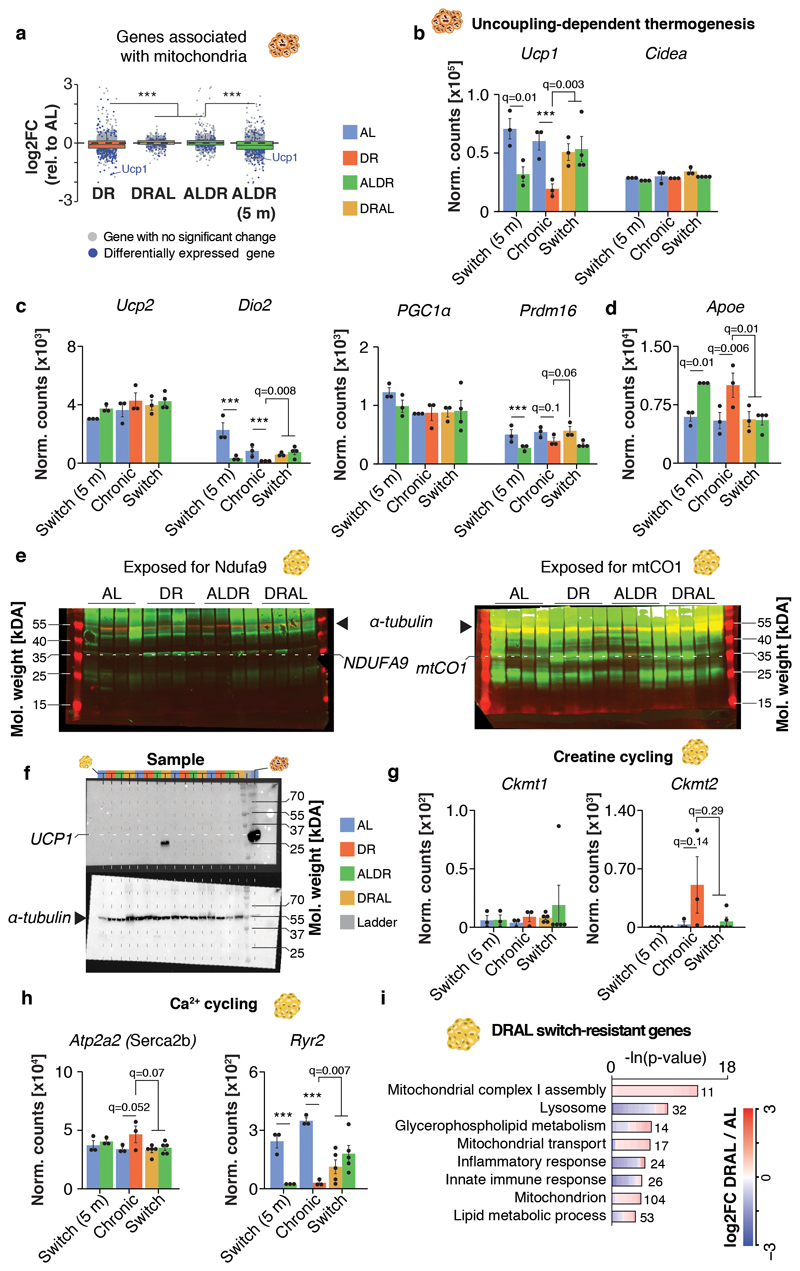
Extended Data Fig. 6. Thermogenic marker expression in WAT and BAT.
a, Distribution of gene-wise expression changes in BAT under chronic DR and switch diets relative to chronic AL feeding for genes associated with the GO term ‘Mitochondrion’. (n = 1299 genes). Whiskers represent 1st and 5th quartile, box edges represent 2nd and 4th quartile and centre line represents 3rd quartile/median. Two-sided Wilcoxon rank-sum test, adjusted for multiple testing. b, mRNA expression (RNA-seq) of thermogenic marker genes in BAT. c, mRNA expression (RNA-seq) of marker for thermogenesis and mitochondrial biogenesis in BAT. d, Apoe mRNA expression (RNA-seq) in BAT. Two-sided Wald test, adjusted for multiple testing. e, Whole LICOR western blot image of Fig.4D. f, Western blot analysis of UCP1 in WAT with α-tubulin as loading control. Tissue extract from one BAT sample (very right lane) was included as positive control for the UCP1 antibody. g-h, mRNA expression (RNA-seq) of uncoupling-independent, thermogenic marker genes in WAT for g creatine cycling and h Ca2+ cycling. Two-sided Wald test, adjusted for multiple testing. i, DRAL switch-resistant genes in WAT. Lengths of bars represent negative ln-transformed p-values using two-sided Fisher’s exact test. The complete list of enriched GO terms can be found in Supplementary Table 4. Biologically independent animals used for RNA-seq: BAT: n=3 (AL, DR, DRAL, AL 5m, ALDR 5m) n=5 (ALDR); WAT: n=3 (AL, DR, ALDR, AL 5m) n=5 (ALDR, DRAL). The Western blot analysis was done once using tissues of n=4 biologically independent animals per diet that were derived from the same cohort but were not identical to the mice used for RNA-seq. Means ± SEM, *** q<0.0001.

