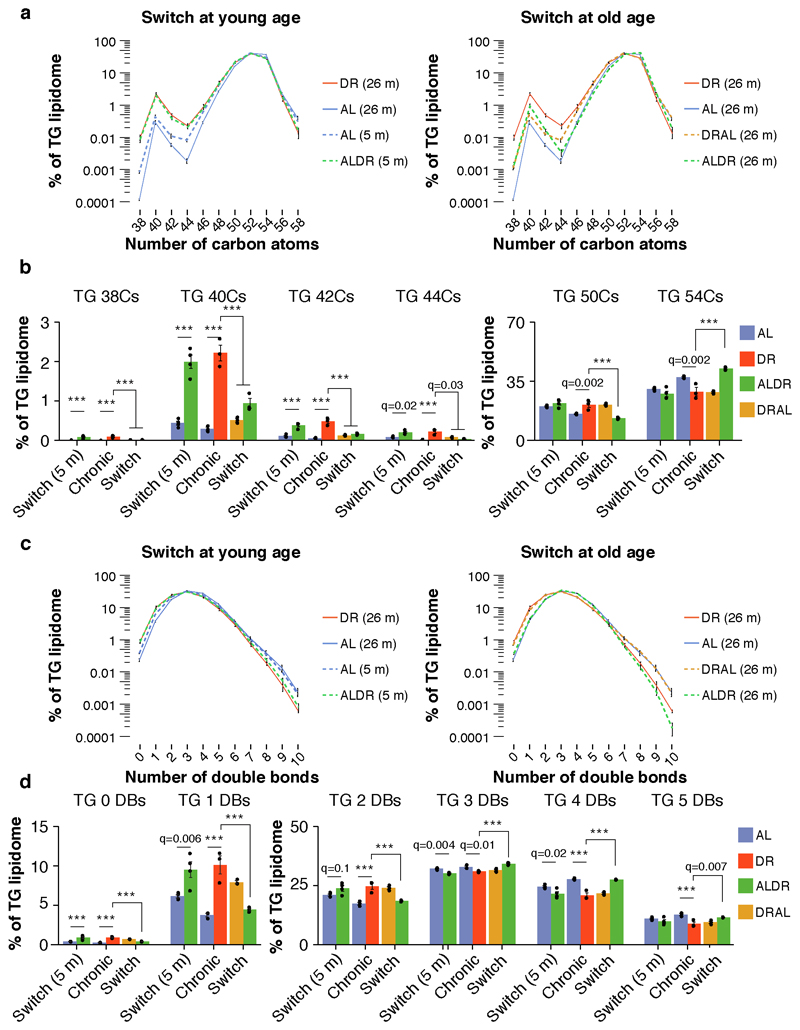
Extended Data Fig. 7. Triglyceride composition in WAT.
a, Distribution of TG species for the switch at young (left) and old (right) age classified according to the number of carbon atoms as proxy for TG-associated fatty acid chain length. Values represent normalized relative abundances (0-100%) on a logarithmic scale. b, Selected TG groups classified according to associated fatty acid chain length. Values are identical to the ones in a. One-way ANOVA followed by two-sided post-hoc Tukey test. c, Distribution of TG species for the switch at (left) young and (right) old age classified according to the number of double bonds in TG-associated fatty acid chains. Values represent normalized relative abundances (0-100%) on a logarithmic scale. d, Selected TG groups classified according to the number of double bonds in associated fatty acids. Values are identical to the ones in c. One-way ANOVA followed by two-sided post-hoc Tukey test. Biologically independent animals used for Lipidomics: n=4 per diet. Means ± SEM, *** p<0.001.

