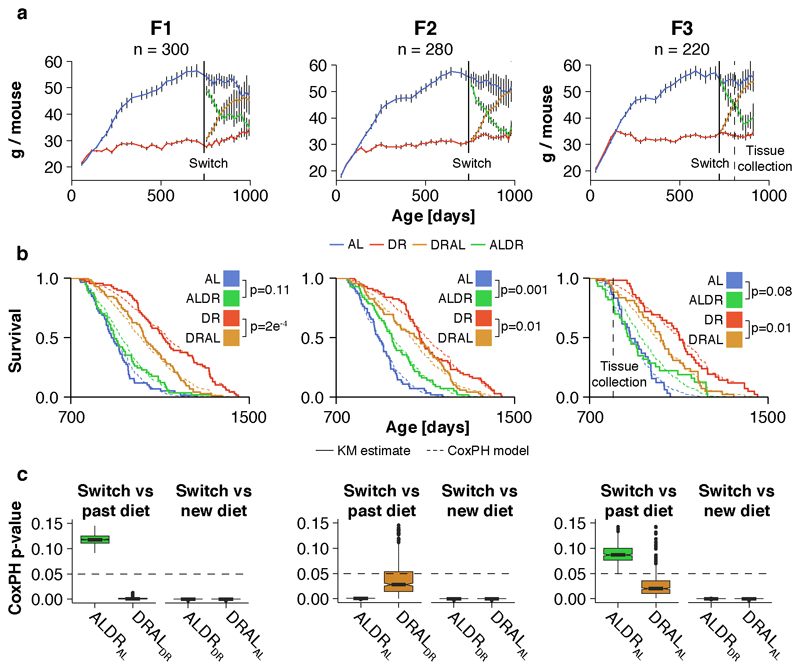
Extended Data Fig. 2. Demography of dietary restriction for each of the three breeding cohorts.
a, Pre- and post-switch weight curves for chronic and switch diet mice from the 3 breeding cohorts (± 95% confidence intervals). Solid and dashed lines indicate the time point for diet switch and tissue collection, respectively. Tissues were collected from the F3 cohort only. Number above graph indicates total cohort size at birth. n=15 biologically independent animals per diet and cohort. b, Cohort-specific post-switch Kaplan-Meier survival curves for chronic and switch diet cohorts. Cox regression (dashed line) was used to avoid making assumptions about the shape of the trajectories. c, Cohort-specific distribution of p-values as computed from n=1000 Cox regression analyses with random down-sampling of DRAL and DR cohorts to match the size of AL/ALDR cohorts. Analyses were run relative to the pre- and post-switch control. Dashed line indicates significance threshold. Whiskers represent 1st and 5th quartile, box edges represent 2nd and 4th quartile and centre line represents 3rd quartile/median. Outliers are marked by points. b, c Biologically independent animals per cohort at start of switch: F1: n=58 (AL) n=69 (DR), n=72 (DRAL), n=57 (ALDR); F2: n=55 (AL) n=69 (DR), n=69 (DRAL), n=56 (ALDR); F=3: n=44 (AL) n=52 (DR), n=53 (DRAL), n=44 (ALDR). Means ± SEM.

