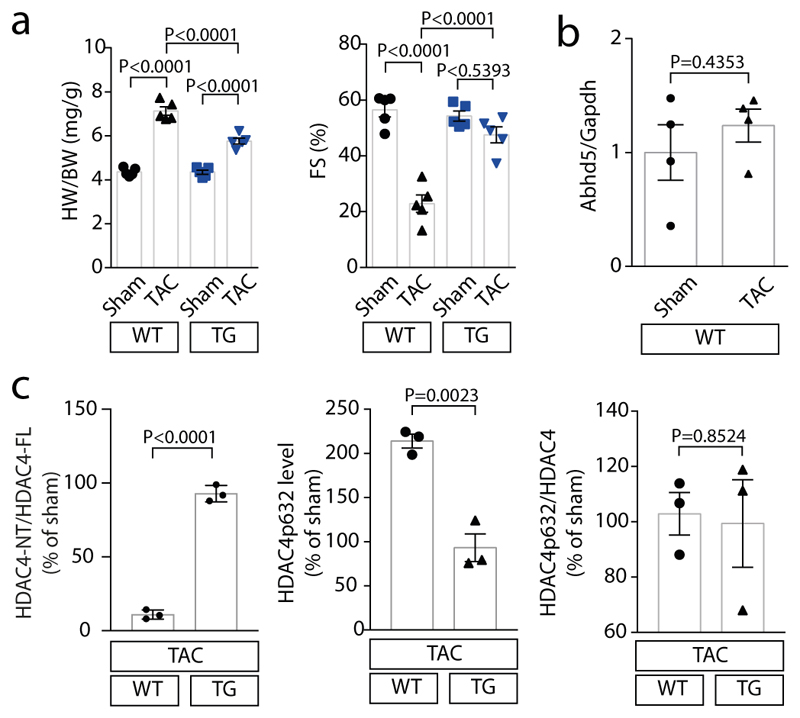
Extended Data Fig. 6. ABHD5 attenuates cardiac hypertrophy upon TAC.
(a) Left panel: Quantification of HW/BW ratio of WT and TG mice three weeks after TAC or sham surgery. Right panel: Quantification of fractional shortening (FS) of WT and TG mice three weeks after TAC or sham surgery. Statistical analysis: Values are presented as Mean±SEM, n=5 (n represents mice per indicated group); by one-way ANOVA, P<0.05 considered as significant. (b) mRNA expression of Abhd5 in sham and TAC operated WT mice normalized to Gapdh. Statistical analysis: Values are presented as Mean±SEM, n=4 (n represents mice per indicated group); by unpaired two tailed t-test, P<0.05 are considered as significant. (c) Corresponding band intensities of experiment shown in Fig. 4d were quantified. Left panel: Ratio between HDAC4-NT and HDAC4-FL. Middle panel: HDAC4 P-632 levels were determined upon TAC in relation to sham in WT and TG mice and normalized to GAPDH. Right panel: Ratio between HDAC4 P-632 and total HDAC4. Statistical analysis: Values are presented as Mean±SEM, n=3 (n represents mice per indicated group); by unpaired two tailed t-test; P<0.05 are considered as significant.

