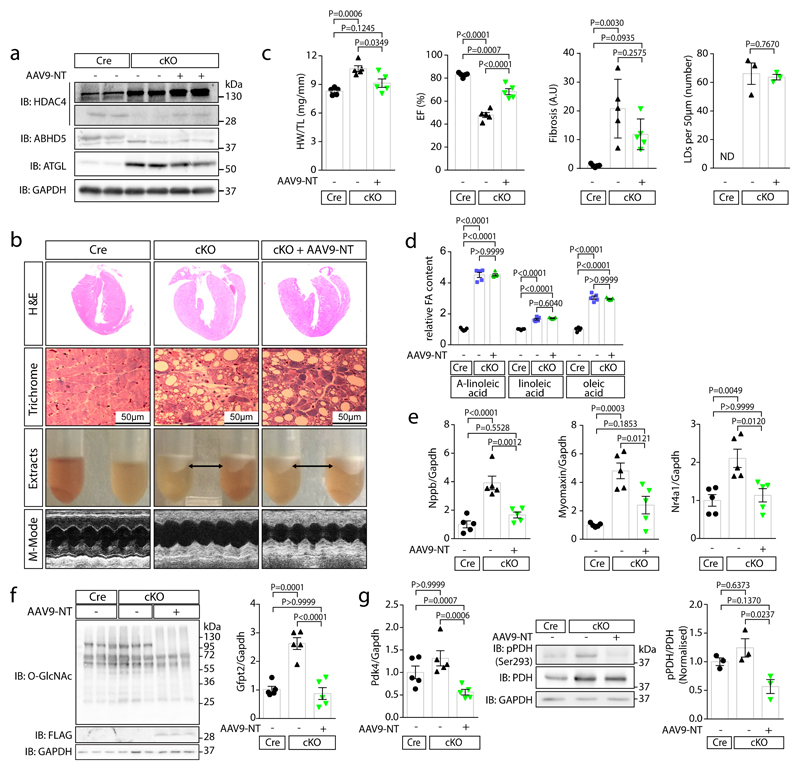
Fig. 3. HDAC4-NT protects from heart failure in NLSD.
Cre-expressing control mice (Cre), cardiac-specific ABHD5-KO (cKO) and cKO with cardiac-specific HDAC4-NT gene delivery (cKO+AAV9-NT) were analyzed. (a) Immunoblotting for HDAC4, ABHD5, ATGL and GAPDH. (b) H&E and Masson’s-trichrome staining (Trichrome) of cardiac sections, a lipid layer after lysis and echocardiographic M-modes are shown. (a–b) Representative samples of one experiment with 5 mice. (c) Quantification of heart weight / tibia length ratios (HW/TL), ejection fraction (EF), fold change in fibrosis level in arbitrary units (A.U.) and number of lipid droplets in left ventricular myocardium (LDs, counted in trichrome sections are shown for the indicated groups). Statistical analysis for all except LDs: Values are presented as Mean±SEM, n=5 (n represents mice per indicated group); by one-way ANOVA, P<0.05 considered as significant. Statistical analysis for LDs: Values are presented as Mean±SEM, n=3 (n represents mice per indicated group); by unpaired two tailed t-test. (d) Relative quantification of indicated long chain fatty acids (FA) in three experimental groups (Cre, cKO and cKO+AAV9-NT). Statistical analysis: Values are presented as Mean±SEM, n=5 (n represents mice per indicated group); by one-way ANOVA, P<0.05 considered as significant. (e) Fold-change in mRNA-level of hypertrophic marker Nppb and specific MEF2 target genes, Myomaxin and Nr4a1, normalized to Gapdh in indicated groups. Statistical analysis: Values are presented as Mean±SEM, n=5 (n represents mice per indicated group); by one-way ANOVA, P<0.05 considered as significant. (f) Left: Immunoblotting of overall O-GlcNAcylation, FLAG-HDAC4-NT and GAPDH in Cre, cKO and cKO+AAV9-NT (n=3, n represents mice per indicated group). Right: Levels of Gfpt2 mRNA. Statistical analysis: Values are presented as Mean±SEM, n=5 (n represents mice per indicated group); by one-way ANOVA, P<0.05 considered as significant. (g) Left: Fold-change of Pdk4 mRNA normalized to Gapdh in indicated groups. Statistical analysis: Values are presented as Mean±SEM, n=5 (n represents mice per indicated group); by one-way ANOVA, P<0.05 considered as significant. Middle: immunoblotting of pyruvate dehydrogenase phosphorylation (pPDH-Ser293), pyruvate dehydrogenase (PDH) and GAPDH. Right: quantification of pPDH/PDH ratios. Statistical analysis: Values are presented as Mean±SEM, n=3 (n represents mice per indicated group); by one-way ANOVA, P<0.05 considered significant.

