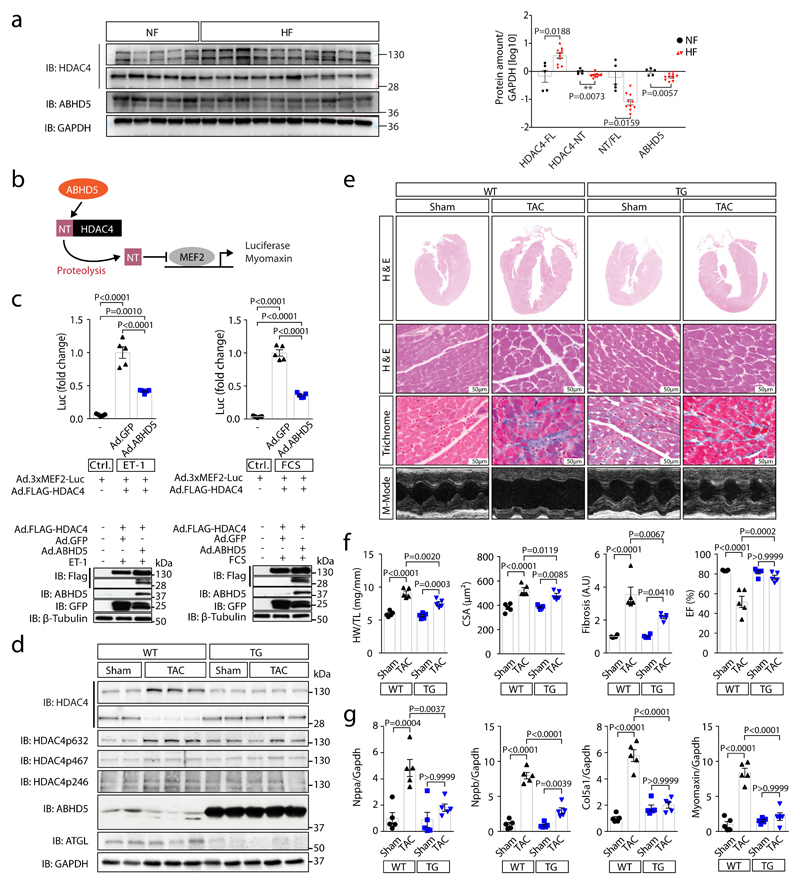
Fig. 4. ABHD5 protects from heart failure.
(a) Left: immunoblotting of HDAC4-FL, HDAC4-NT, ABHD5 and GAPDH in non-failing (NF, lanes 1-5) and failing human myocardium (HF; lanes 6-10: dilated cardiomyopathy, DCM; lanes 11-15: ischemic cardiomyopathy, ICM). Right: Corresponding band intensities were normalized to GAPDH, and HDAC4-NT was normalized to HDAC4-FL. Statistical analysis: Values are presented as Mean±SEM, n=5 (NF) and n=10 (HF, n indicates separate human samples); by unpaired two tailed t-test, P<0.05 was considered as significant. (b) MEF2 activity was assessed by a luciferase reporter assay or Myomaxin expression in response to ABHD5-induced proteolysis of HDAC4. (c) Upper: MEF2 activity measured in lysates of endothelin-1 (ET-1) or fetal-calf-serum (FCS) stimulated NRVMs following transduction with indicated adenoviral constructs (Ad.3xMEF2C-Luc, Ad.FLAG-HDAC4, Ad.ABHD5 plus GFP on a bicistronic promoter or Ad.GFP). Statistical analysis: Values are presented as Mean±SEM, n=5 (n represents independent samples); by one-way ANOVA, P<0.05 considered as significant. Lower: Immunoblotting for FLAG-HDAC4, ABHD5, GFP and β-Tubulin (loading control) on luciferase assay lysates. Results shown represent at least three independent experiments. (d) Cardiac extracts from transgenic ABHD5 mice and wild type littermates (WT) three weeks after sham or TAC surgery were analyzed by immunoblotting. Expression of ABHD5 as well as HDAC4 and phosphorylated HDAC4, ATGL and GAPDH were detected. (e) Representative images of H&E staining, Masson’s-trichrome (Trichrome) staining, echocardiographic M-modes. (d-e) Representative samples of one experiment with 5 mice. (f) Quantification of heart weight / tibia length ratios (HW/TL), n=5, cardiomyocyte cross-sectional area (CSA), n=5, fibrosis in arbitrary units (A.U.), n=4 for sham WT and TG; and n=5 for TAC WT and TG, and ejection fraction (EF), n=5 (n represents mice per indicated group). Statistical analysis: Values are presented as Mean±SEM; by one-way ANOVA, P<0.05 considered as significant. (g) RT-PCR analysis of Natriuretic Peptide A (Nppa), Natriuretic Peptide B (Nppb), collagen 5a1 (Col5a1) and Myomaxin. Statistical analysis: Values are presented as Mean±SEM, n=5 (n represents mice per indicated group); by one-way ANOVA, P<0.05 considered as significant.

