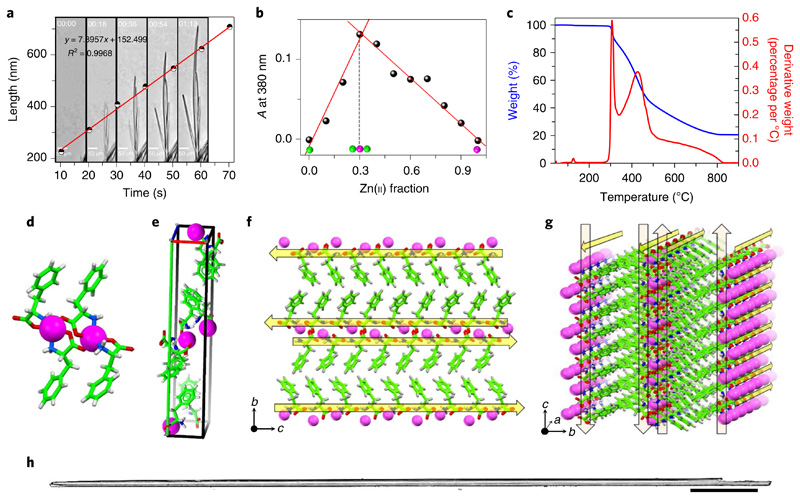
Fig. 2. Characterization of F–Zn(ii).
a, Optical microscopy snapshots taken from Supplementary Video 1 that monitor the assembly kinetics of the F–Zn(ii) needle-like architectures captured every 18 s which are graphical representations of the elongation rate of a single structure. The calculated average measured elongation rate is 7.89 nm s−1. b, A UV–visible Job plot that monitors the absorption (A) at 380 nm as a function of the fraction of Zn(ii) ions. The inflection point at 0.3 corresponds to a stable 2:1 (F:Zn(ii)) binding stoichiometry. c, Thermogravimetric analysis of F–Zn(ii) crystals (blue curve) that reveals the high thermal stability (≤300 °C). The weight losses are depicted by the first derivative curve (red). d–g, Crystallographic insights of F–Zn(ii) (CCDC 1850564). d, Zinc-coordinated phenylalanine assembly that exhibits a 2:1 (F:Zn(ii)) primary complex structure. e, Unit cell that displays eight phenylalanine molecules and four Zn(ii) ions. f,g, Supramolecular cross-β-sheet layered organization along the crystallographic b–c (f) and a–b (g) planes. Yellow arrows direct from the the N to the C terminus of F. h, Optical microscope images of needle-like, long, single crystals of F–Zn(ii). Scale bar, 500 μm.

