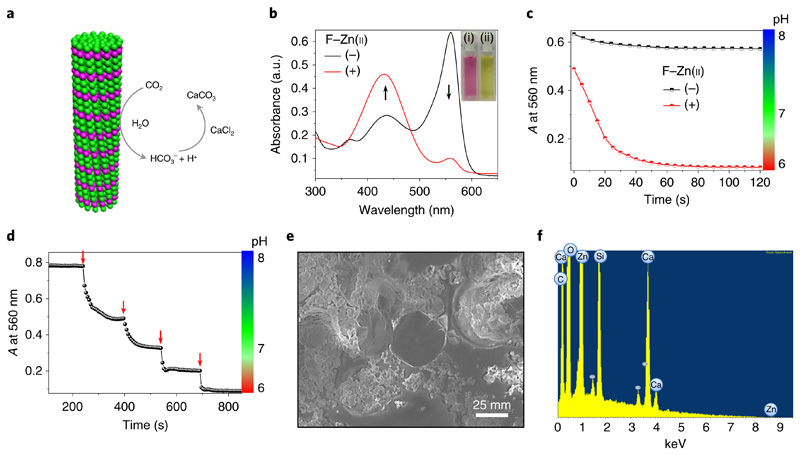
Fig. 5. F–Zn(ii) catalytic carbon dioxide hydration and sequestration.
a, Schematic representation of F–Zn(ii) catalytic CO2 hydration and sequestration on reaction with CaCl2 to produce solid CaCO3. b, UV–visible absorption spectral changes of the pH indicator phenol red (5 × 10⁻⁵ M) in a mixture containing CO2-treated deionized water in Tris buffer (pH 8) with (+) and without (−) the F–Zn(ii) (3.7 × 10⁻⁴ M) catalyst. The black arrows show the changes in the peaks following addition of F-Zn(ii). Inset: images of the corresponding solutions without (left) and with (right) F–Zn(ii). c, The time-dependent absorbance at 560 nm and the corresponding pH profile of phenol red in CO2-treated deionized water, Tris buffer (pH 8) in the absence (−) and presence (+) of F–Zn(ii). d, Stepwise drop in absorbance at 560 nm and respective pH by sequential addition of CO2-treated deionized water (10 μl, red arrows) into the Tris buffer (25 mM, pH 8) containing F–Zn(ii). e, Scanning electron micrograph of the solid precipitate after sequestration of CO2-treated F–Zn(ii) aqueous solution with CaCl2. f, Energy dispersive X-ray spectrum of the precipitate showing calcium (Ca), along with carbon (C), oxygen (O) and zinc (Zn) elements.

