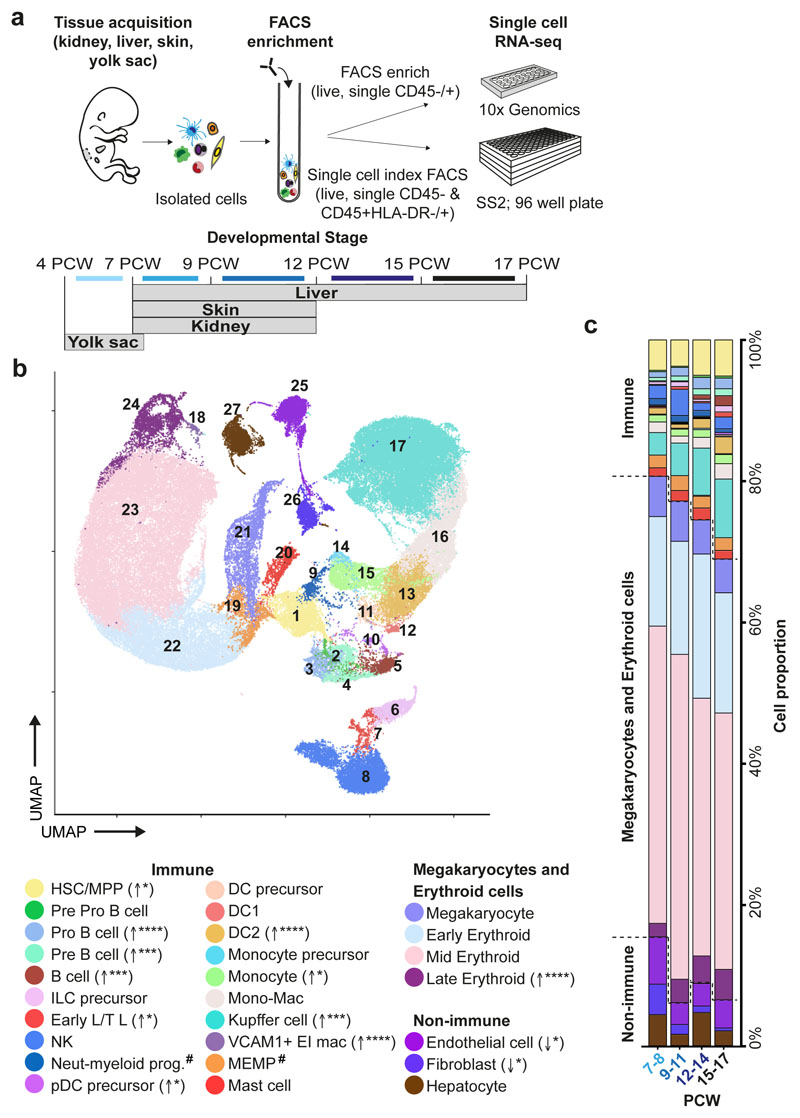
Figure 1. Single cell transcriptome map of fetal liver.
a, Schematic of tissue processing and cell isolation for scRNA-seq profiling of fetal liver, skin and kidney across four developmental stages (7-8, 9-11, 12-14, and 15-17 post conception weeks (PCW)), and yolk sac from 4-7 PCW. SS2, Smart-seq2. b, UMAP visualisation of fetal liver cells from 10x using 3’ chemistry. Colours indicate cell state. HSC/MPP, haematopoietic stem cell/multipotent progenitor; ILC, innate lymphoid cell; NK, natural killer cell; Neut-myeloid, neutrophil-myeloid; DC, dendritic cell; pDC, plasmacytoid DC; Mono-mac, monocyte-macrophage; EI, erythroblastic island; Early L/TL, Early lymphoid/T lymphocyte; MEMP, megakaryocyte-erythroid-mast cell progenitor. Statistical significance of cell frequency change by stage shown in parentheses (negative binomial regression with bootstrap correction for sort gates; * p < 0.05, *** p < 0.001, and **** p < 0.0001 as per SI Table 8) with up/down arrows to indicate positive/negative coefficient of change, respectively. c, Liver composition by developmental stage as the mean percentage of each population per stage corrected by CD45+/CD45- sort fraction. Colours indicate cell states as shown in b.

