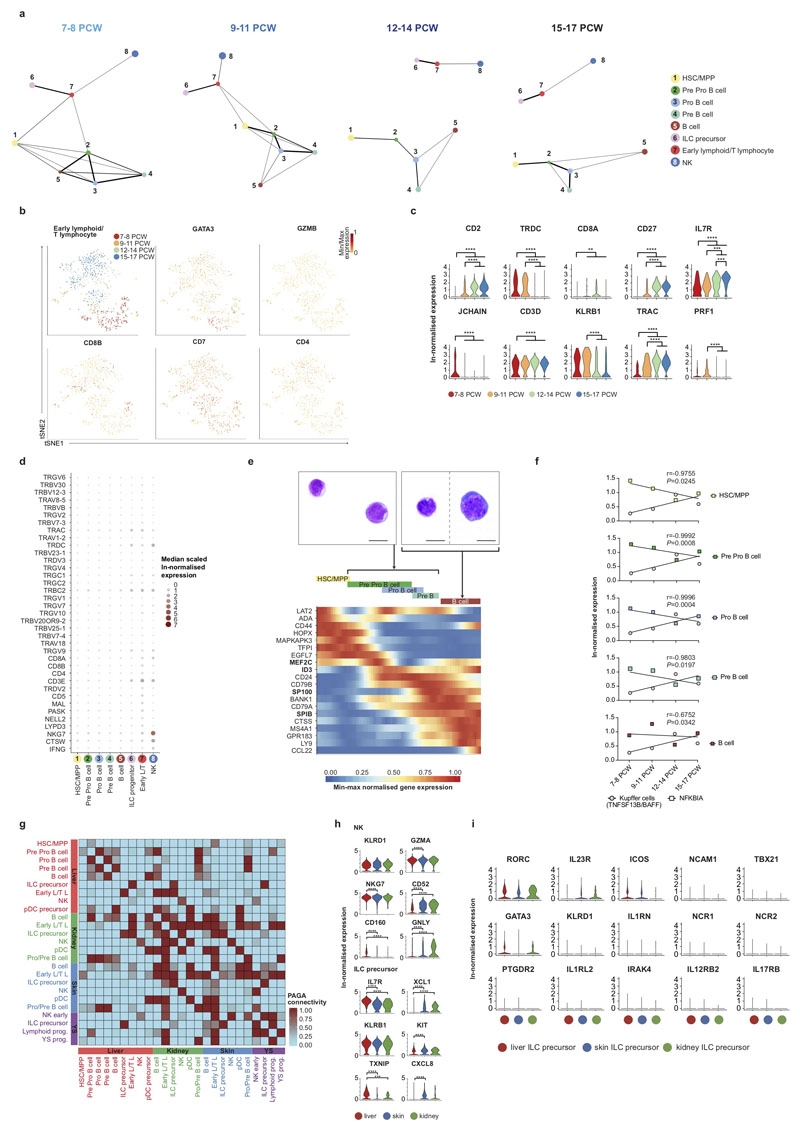
Extended Data Figure 5. Lymphoid lineages in fetal liver and NLT.
a, PAGA analysis of fetal liver HSC/MPP and lymphoid cell types from Figure 1b showing changes over four developmental stages. Lines symbolise connection; line thickness corresponds to the level of connectivity (thin to thick = low to high PAGA connectivity). b, Feature plots and c, violin plots showing ln-normalised median expression of selected known NK, ILC and T cell genes over gestation for early lymphoid/T lymphocyte cluster; ** p < 0.001; *** p < 0.005; **** p < 0.0001. d, Dot plot showing median scaled ln-normalised median expression of V(D)J transcripts in fetal liver lymphoid cell types. Gene expression indicated by spot size and colour intensity. e, Heat map showing normalised expression of statistically significant, dynamically variable genes from pseudotime analysis for B cell lineage inferred trajectory (likelihood ratio test). Transcription factors are in bold. Morphology of liver Pro/Pre B cells and B cells by Giemsa stain after cytospin. f, ln-normalised expression (mean +/- s.e.m.) of TNFSF13B in Kupffer cells and NFKBIA in HSC/MPPs and cells in the B cell lineage across 4 developmental stages spanning 6-17 PCW; trend lines showing linear regression. g, PAGA connectivity scores of HSC/MPP and lymphoid cells from fetal liver, skin, kidney and yolk sac. h, ln-normalised median expression of selected known NK (left) and ILC precursor (right) marker genes and selected differentially expressed genes between liver (red), skin (blue) and kidney (green) visualised by violin plots (*** p < 0.005; **** p < 0.001). i, Violin plots showing ln-normalised median expression of selected known ILC and NK cell genes expressed in ILC precursors from fetal liver, skin, and kidney.

