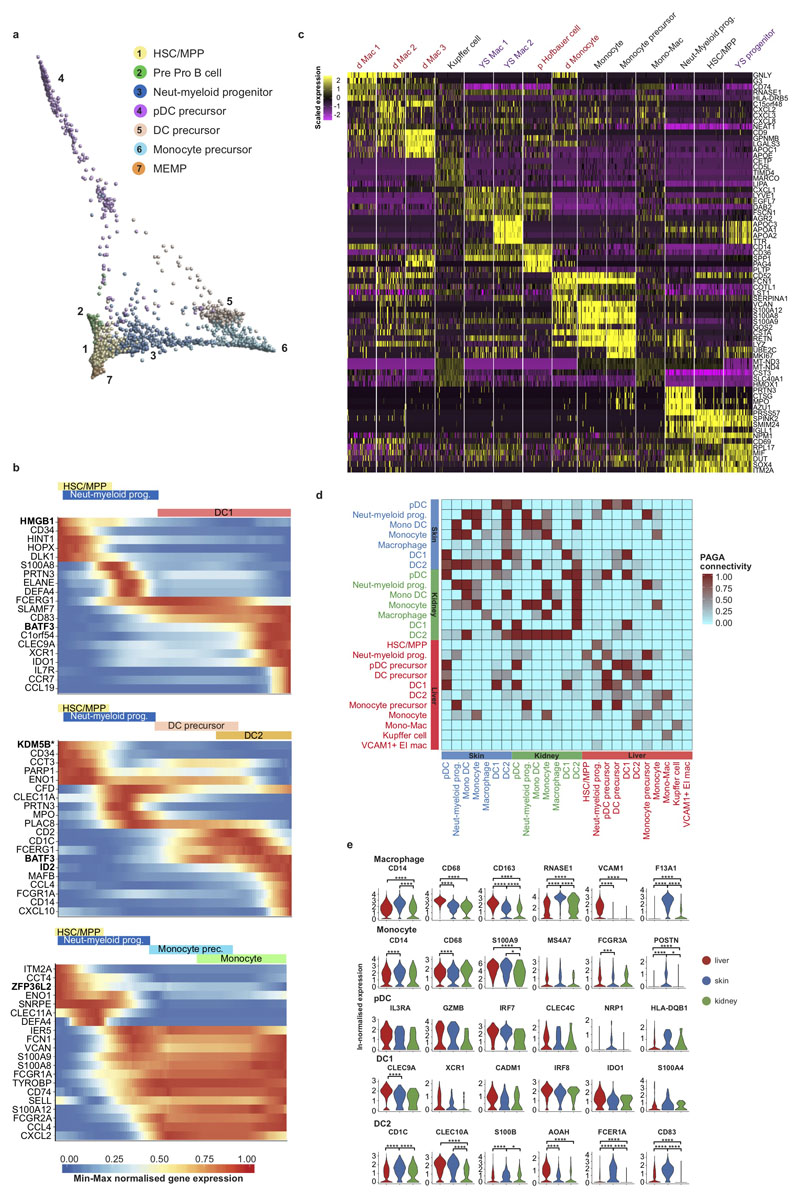
Extended Data Figure 6. Tissue signatures in developing myeloid cells.
a, Diffusion map of fetal liver HSC/MPP, progenitors and precursors from 1b. b, Heat map showing min-max normalised expression (p < 0.001) of dynamically variable genes from pseudotime analysis for monocyte, DC1 and DC2 inferred trajectories. Transcription factors in bold, * mark genes not previously implicated for the respective lineages. c, Heat map visualisation comparing scaled expression of the top marker genes of decidua/placenta (red), fetal liver (black) and yolk sac (purple) progenitor and myeloid populations. d, PAGA connectivity scores of HSC/MPP and myeloid cells from fetal liver, skin and kidney. e, ln-normalised median expression of 3 known marker genes & 3 differentially expressed genes in corresponding myeloid populations across fetal liver, skin and kidney visualised by violin plots (* p < 0.05; *** p < 0.005; **** p < 0.0001).

