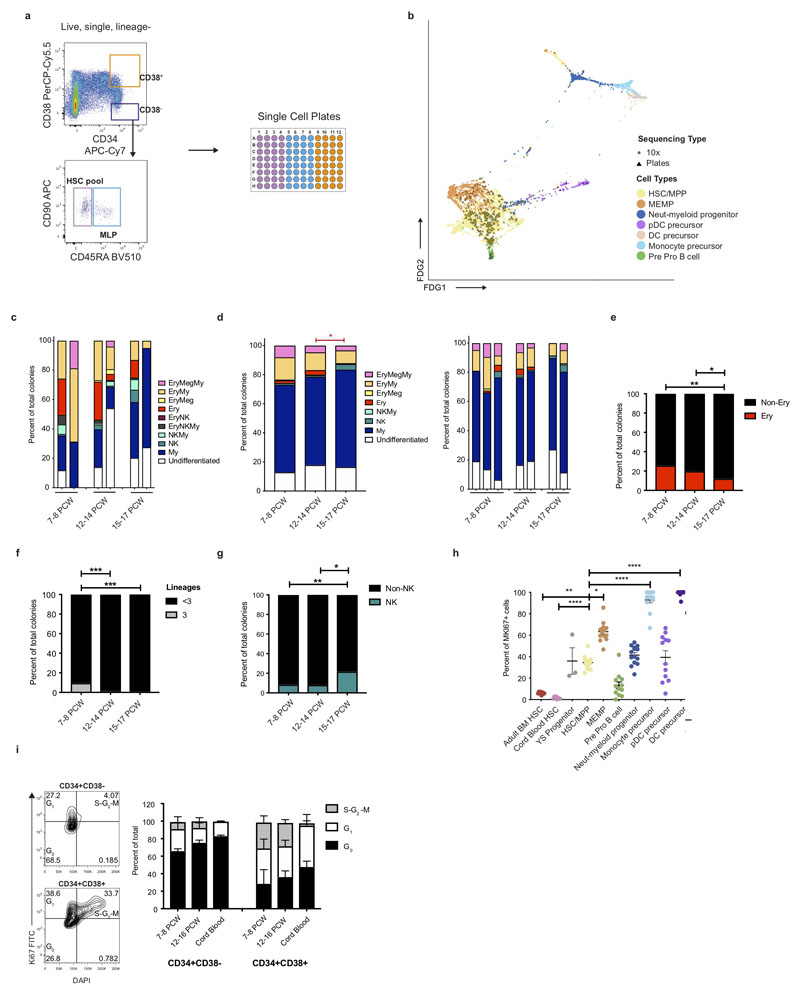
Extended Data Figure 7. HSC/MPP differentiation potential by gestation.
a, Experimental design for single cell transcriptome and culture of fetal liver cells from representative FACS gates illustrated. b, Alignment of 349 scRNA-seq profiled cells from FACS gates in a with 10x profiled HSC/MPPs and early progenitors visualised using FDG, point shape corresponds to sequencing type (triangle = SS2 plate data, circle = 10X data). c, Stacked barplot of all different types of colonies generated by single ‘HSC pool’ gate cells (gate defined in a). d, Stacked bar plot of all different types of colonies generated by single ‘HSC pool’ gate cells without MS5 stroma layer (gate defined in a) by stage (left) and in individual samples (right), * p < 0.05. e, Percentage of colonies generated by single ‘HSC pool’ cells without MS5 stroma layer containing erythroid cells (sum of Ery, Ery/Meg, Ery/Meg/My, and Ery/My colonies shown in c), ** p < 0.01. f, Percentage of colonies from single cell culture (shown in 6c) that differentiated along 3 lineages (defined as sum of Ery/NK/My and Ery/Meg/My colonies) branches (*** p < 0.005). g, Percentage of colonies containing NK cells following B/NK optimised culture of 10 cells from ‘HSC pool’ gate (* p < 0.05, ** p < 0.01). h, Percentage (Mean +/- s.e.m.) of HSC/MPP and early progenitors in fetal liver, yolk sac, cord blood and adult bone marrow expressing MKI67 (* p < 0.05, ** p < 0.01, **** p < 0.001). i, Mean +/- s.d. percentage of CD34+CD38- and CD34+CD38+cells in the indicated cell cycle phases (right) as determined by flow cytometry analysis (left, representative plot of n = 8 biologically independent samples) (G0: Ki67-DAPI-, G1: Ki67+DAPI-, S-G2-M: Ki67+DAPI+ (left)).

