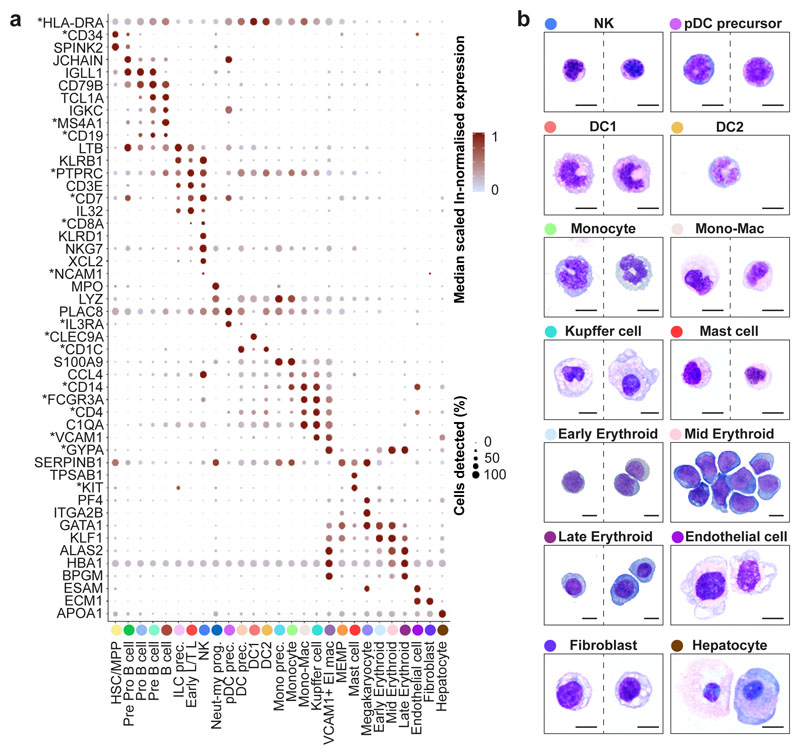
Figure 2. Multi-modal and spatial validation of cell types.
a, Median scaled ln-normalised gene expression of 48 selected differentially expressed genes for the liver cell states from 1b visualised by dot; asterisk (*) indicates markers used for FACS-isolation of cells. Gene expression frequency (% cells within cell type expressing) indicated by spot size and expression level by colour intensity. Neut-my, Neutrophil-myeloid; prec., precursor; mono, monocyte. b, Representative Giemsa-stained cytospins showing morphology of populations isolated by FACS based on differentially expressed genes with * in a. Scale bar, 10μm.

