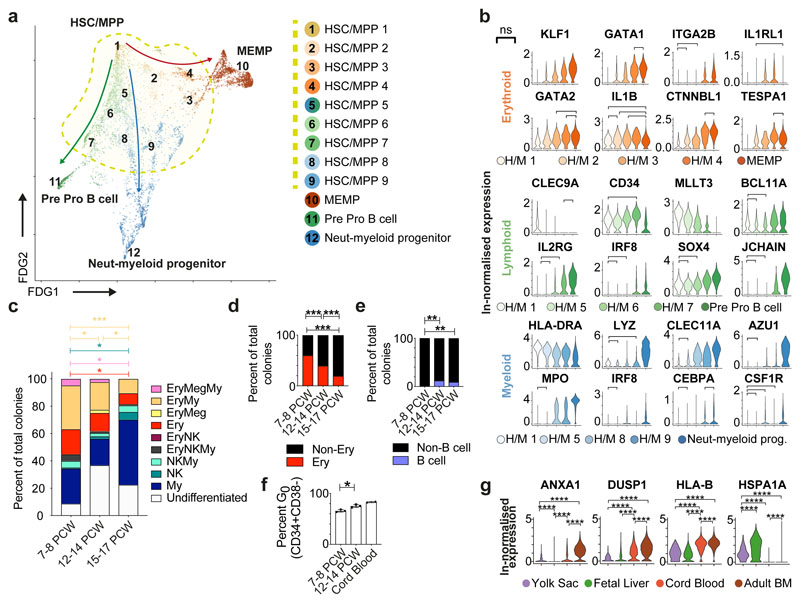
Figure 6. HSC/MPP differentiation potential by gestation.
a, FDG visualisation of liver HSC/MPP and early haematopoietic progenitor populations from Figure 1b. b, Violin plots showing ln-normalised median gene expression of statistically significant, dynamically variable genes that are up or downregulated during HSC/MPP transition to neutrophil-myeloid progenitors, MEMP and pre pro-B cells from fetal liver. Bar and ‘ns’ indicate not significant. H/M, HSC/MPP. c, Stacked barplot of all different types of colonies generated by single ‘HSC pool’ gate cells in an assay with MS5 stroma. * p < 0.05, *** p < 0.001, individual samples shown in Extended Data 7c. The colour of the stat bar corresponds to the type of colony tested vs all others. My, Myeloid; Ery, Erythroid, Meg, Megakaryocyte. d, Percentage of colonies generated by single ‘HSC pool’ gate cells containing erythroid cells (defined as the sum of Ery, Ery/Meg, Ery/Meg/My, Ery/My, Ery/NK and Ery/NK/My colonies shown in c), *** p < 0.001. My, Myeloid; Ery, Erythroid; Meg, Megakaryocyte. e, Percentage of colonies containing B cells following culture in B/NK optimized conditions from 10 cells from ‘HSC pool’ gate (** p < 0.01). f, Mean +/- s.d. percentage of cells in the G0 phase of the cell cycle assessed using Ki67 and DAPI flow cytometry analysis (* p = 0.0136). g, ln-normalised median expression of selected genes in yolk sac progenitors, cord blood HSC and adult bone marrow HSC with significant differential expression compared to fetal liver HSC/MPP, visualised by violin plots (**** p < 0.0001).

