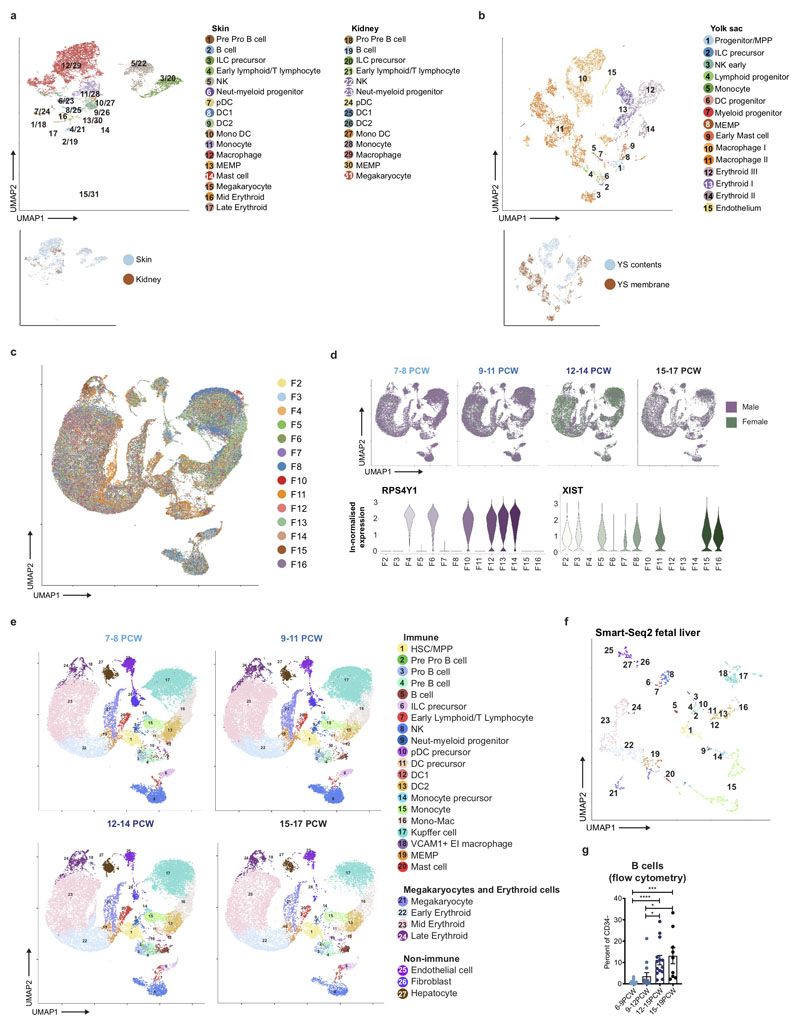
Extended Data Figure 1. Single cell transcriptome map of fetal liver.
a, Fetal skin and kidney haematopoietic cells visualised by UMAP. Colours indicate cell state. Inset: colours indicate tissue type. b, UMAP visualisation of yolk sac haematopoietic cells. Colours indicate cell state. Inset: colours indicate location within yolk sac. c, UMAP visualisation of 3’ liver 10x cells post batch correction, coloured by sample. d, UMAP visualisation (top) of 3’ 10x liver sample sex mixing grouped by developmental stage, and violin plots (bottom) showing ln-normalised median expression of XIST (green) and RSP4Y1 (purple), which marks female and male samples respectively. e, UMAP visualisation of fetal liver composition by developmental stage. Colours indicate cell state. f, UMAP visualisation of fetal liver cells profiled using Smart-seq2. Colours indicate cell states as shown in e. g, Frequency (mean +/- s.e.m.) of B cells in the CD34- cells detected in 6-19 PCW fetal livers by flow cytometry (* p < 0.05; *** p = 0.003; **** p < 0.001).

