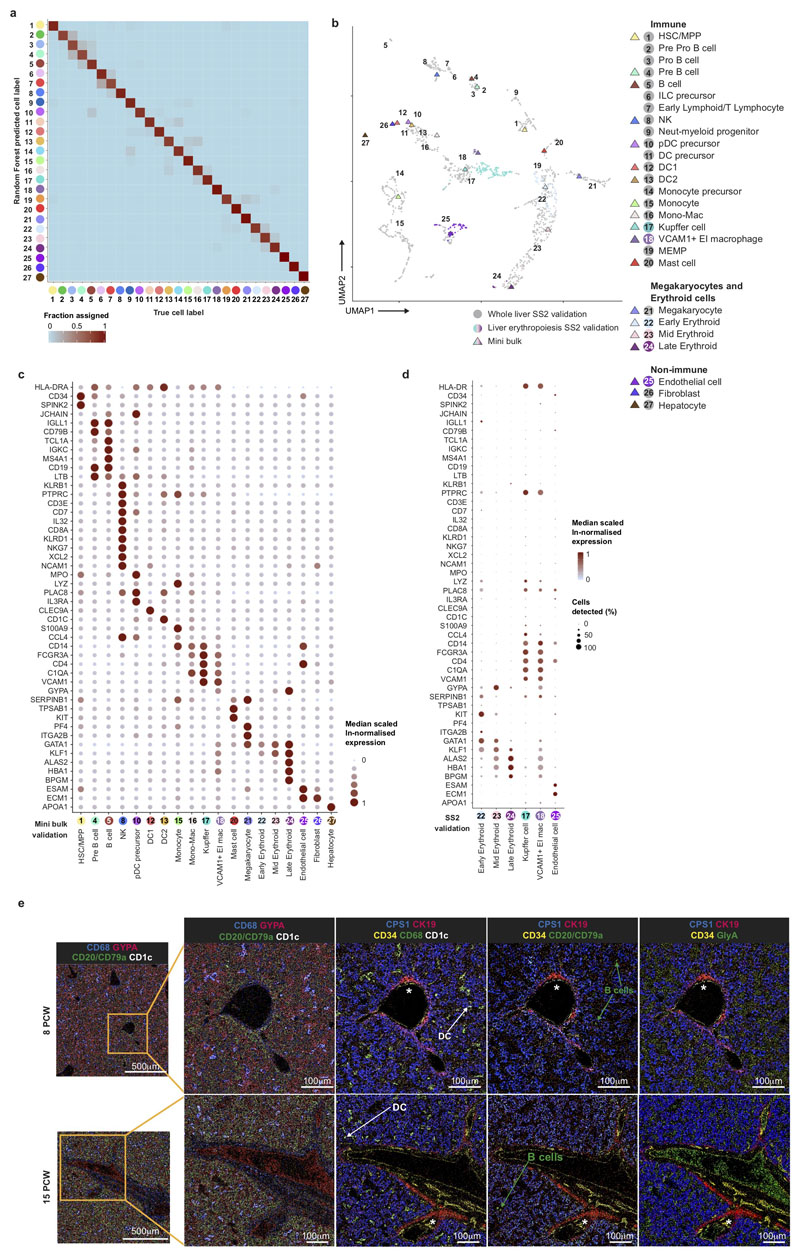
Extended Data Figure 2. Transcriptome validation of fetal liver cells.
a, Assessment of 48 genes from the 4,471 highly variable genes by using a Random Forest classifier to assign cell labels, where ‘true cell label’ indicates the manual annotation based on the full list of variable genes. b, Comparison of representative mini bulk RNAseq data (in coloured triangles) and liver erythroblastic island (EI) populations (early, mid and late erythroids, VCAM1+ EI macrophages), Kupffer cells and endothelium validated by SS2 (in colour) overlaid on whole liver SS2 populations (grey). c, Dot plot showing representative median scaled ln-normalised gene expression of 100 FACS-isolated liver cells based on marker gene expression in Figure 2a. Gene expression indicated by spot size and colour intensity. d, Dot plot showing median scaled ln-normalised gene expression of FACS sorted single cells from liver erythroblastic island (EI) populations (early, mid and late erythroids, VCAM1+ EI macrophages), Kupffer cells and endothelium shown as coloured dots in b based on marker gene expression in Figure 2a. Gene expression frequency (% cells within cell type expressing) indicated by spot size and expression level by colour intensity. e, Overlay pseudo-colour Hyperion representative images for 8 PCW and 15 PCW fetal liver. Far left images are shown at 5x magnification with zoom of insets on right at 20x magnification (1μm/pixel). Bile ducts are marked with an *.

