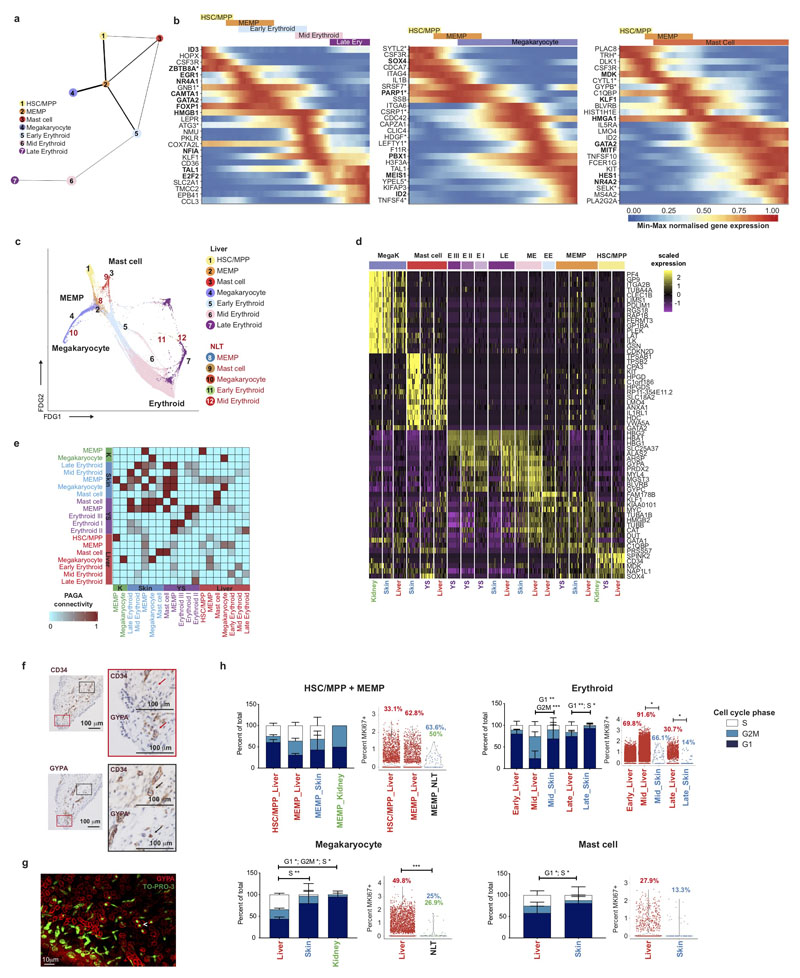
Extended Data Figure 3. Fetal liver and NLT haematopoiesis.
a, PAGA analysis of fetal liver HSC/MPP, erythroid, megakaryocyte and mast cell lineages from Figure 3a. Lines symbolise connection; line thickness corresponds to the level of connectivity (thin to thick = low to high PAGA connectivity). b, Heat map showing min-max normalised expression of statistically significant (p < 0.001), dynamically variable genes from pseudotime analysis for erythroid, megakaryocyte and mast cell inferred trajectories. Transcription factors in bold, asterisk (*) mark genes not previously implicated for the respective lineages. c, FDG visualisation of fetal liver, skin and kidney HSC/MPP, MEMP, erythroid, megakaryocyte and mast cell lineages. d, Heat map showing the scaled ln-expression of selected marker genes in fetal liver, NLT and yolk sac subsets. e, PAGA connectivity scores of HSC/MPP, erythroid, megakaryocyte and mast cell lineages between fetal liver, skin, kidney (K) and yolk sac. f, Representative immunohistochemical staining of sequential sections of 8 PCW fetal skin for endothelium (CD34+) and erythroblasts (nucleated and GYPA+), nuclei stained with blue alkaline phosphatase. Zoom in of insets (right) bordered with black (top) indicate nucleated cells stained positive for GYPA within CD34+ blood vessels, and those bordered with red (bottom) indicate nucleated GYPA+ cells outside CD34+ blood vessels. Scale bar, 100μm. g, Representative light sheet fluorescence microscopy of embryo (5 PCW) hand skin. Scale bar, 5μm; TO-PRO-3/nuclei = red, GYPA = green (see also Supplementary Video 2). < indicates extravascular nucleated erythroid cells. h, Stacked barplots (right) of the mean +/- s.d. percent of fetal liver (red), skin (blue) and kidney (green) HSC/MPP, MEMP, Erythroid, Megakaryocyte and Mast cells in each stage of the cell cycle (G1 (navy), G2M (blue), and S (white) phase), and ln-normalised median expression of MKI67 transcript (right) in corresponding liver vs NLT cell types (total percent of MKI67 expressing cells stated above plots; each dot represents a single cell). * p < 0.05; ** p < 0.01; *** p < 0.005.

