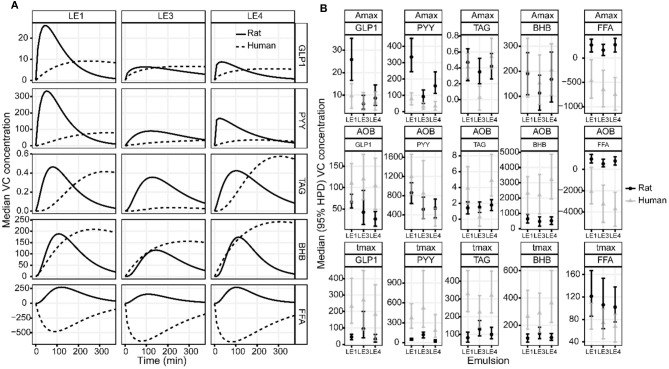
Figure 5.
(A) Estimated group average DOB curves and (B) parameter estimates of the GLP-1, PYY, TAG, BHB, and FFA plasma concentration profiles in rats and humans after intake of the three different LEs. (A) The DOB curves are grouped by LE (columns) and blood parameter (rows). Solid and dashed black lines indicate group average rat and human DOB curves, respectively. The concentration profiles have units ρg/mL for GLP-1 and PYY, mmol/L for TAG, μmol/L for BHB and FFA. (B) The boxplots are grouped by parameter (rows) and blood measure (columns). The values for Amax are equal to the respective concentration profiles. The values for AOB are ρg/mL·h for GLP-1 and PYY, mmol/L·min for TAG, μmol/L·min for BHB and FFA. The value of tmax is given in min.

