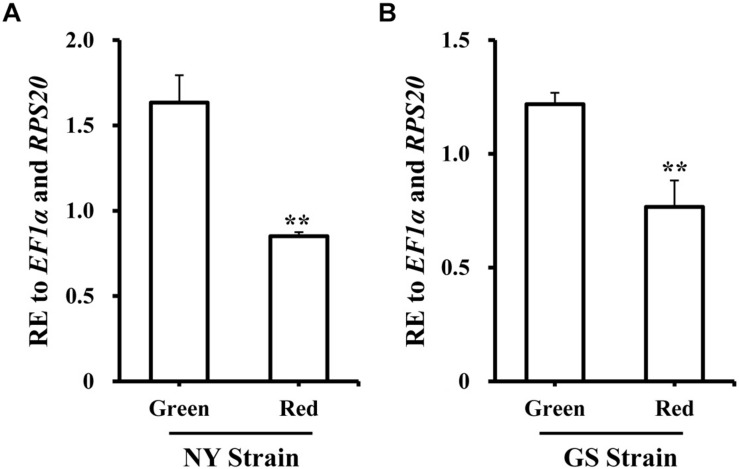
FIGURE 2.
Expression profiles of GGPPS in green and red morphs of the NY and GS strains of Acyrthosiphon pisum. (A) Expression patterns of GGPPS in red and green morphs of NY strain. (B) Expression patterns of GGPPS in red and green morphs of GS strain. A significant difference between red and green morphs is indicated by asterisks (∗∗P < 0.01).

