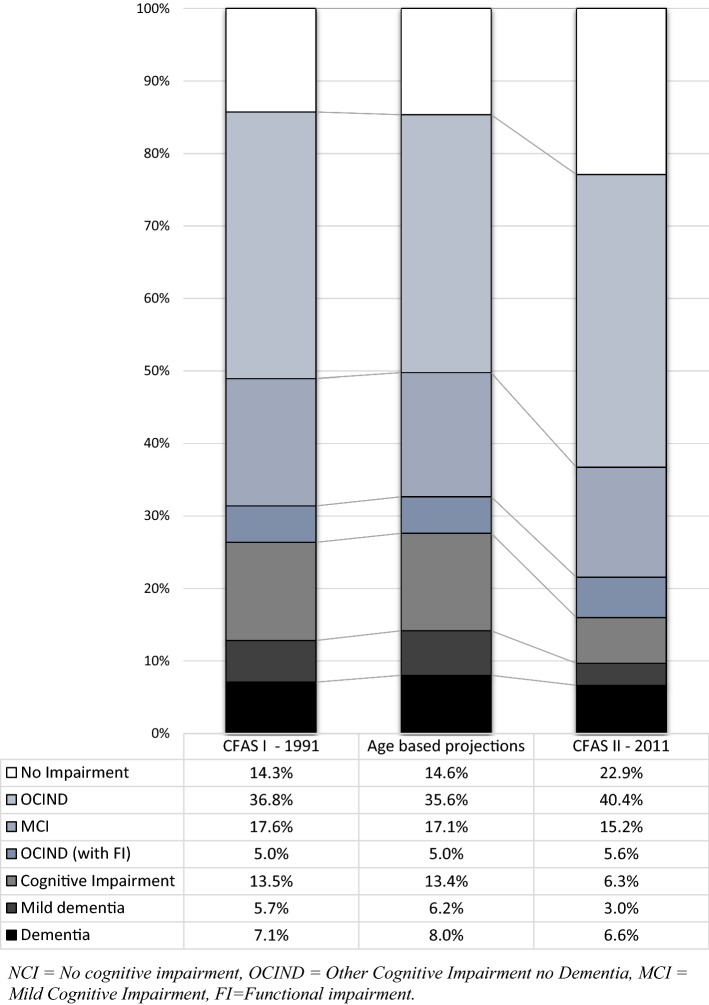
Fig. 3.
Prevalence of cognitive impairment standardized to UK population age and sex structure (%). Estimates were obtained using multiple regression modelling, age based projections for 2011 were obtained using 1991 estimates applied to 2011 population. NCI, no cognitive impairment, OCIND, other cognitive impairment no dementia, MCI, mild cognitive impairment, FI, functional impairment

