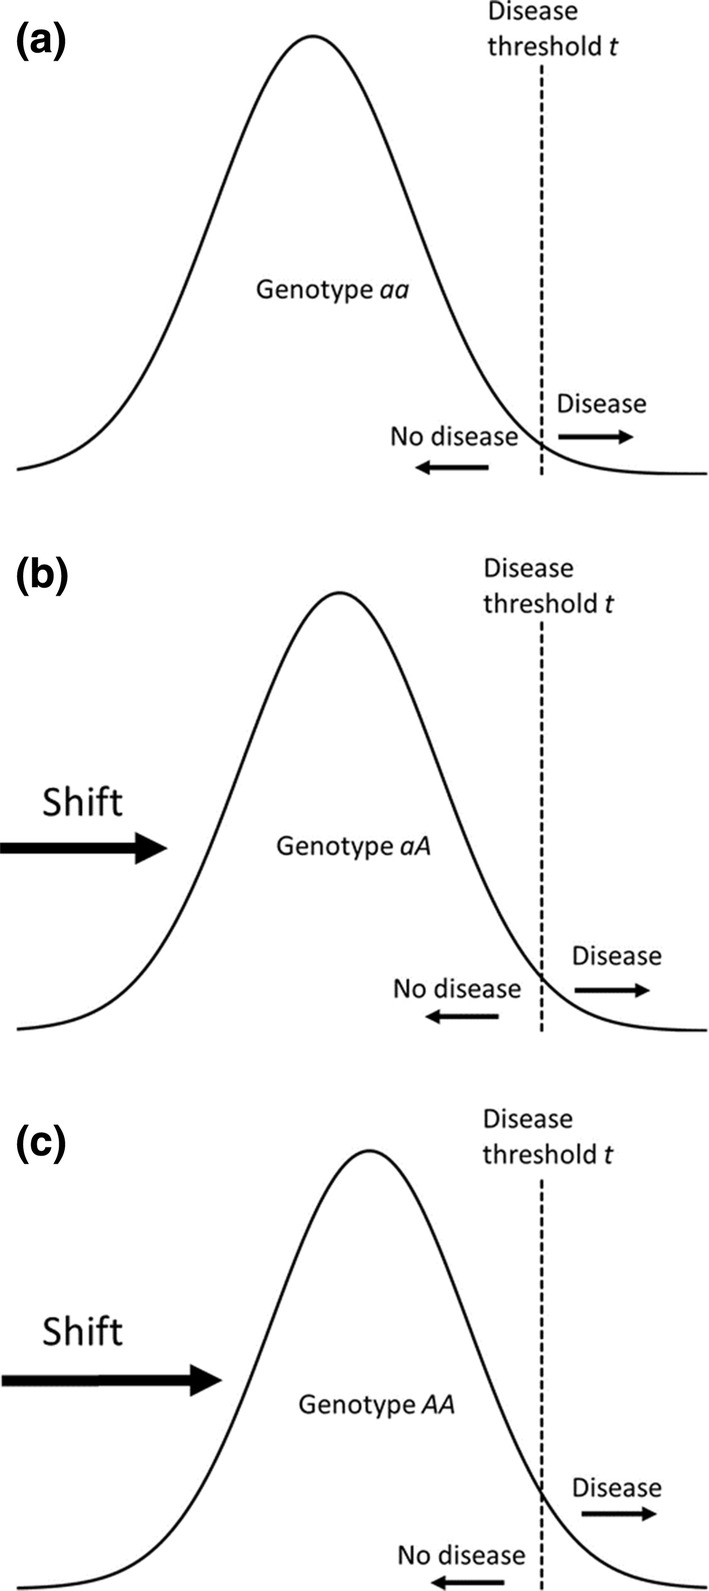
Fig. 1.

Conceptual illustration of the heritability model for a genetic variant A at a specific locus. The distribution of the liability is assumed to be normally distributed with the same variance in the three genotype groups. a Genotype aa (reference group) b Genotype aAc Genotype AA. The shifts in liability is determined by the magnitude of the increased risk associated with A. Disease is assumed to occur if the liability exceed a certain threshold t (vertical dashed lines)
