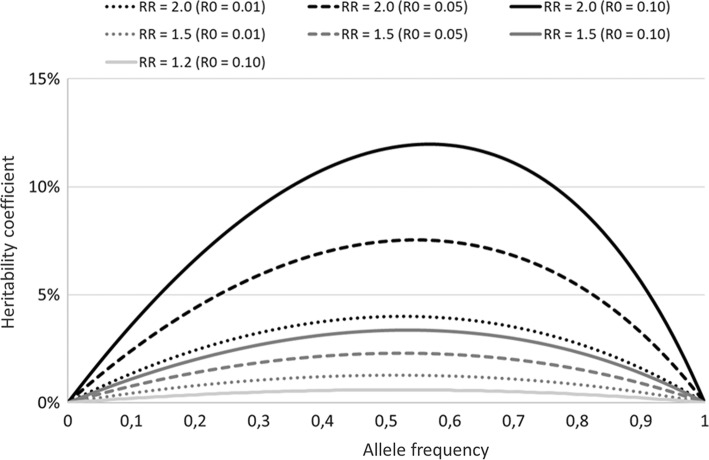
Fig. 2.
The association between risk allele frequency (p) and heritability coefficient (h2) at various levels of the relative risk (RR; 1.2, 1.5 or 2.0) for disease per copy of the risk allele and the baseline risk (R0; 0.01, 0.05 or 0.10). For RR = 1.2 only R0 = 0.10 is shown since h2 is marginal when R0 < 0.10 at this effect level

