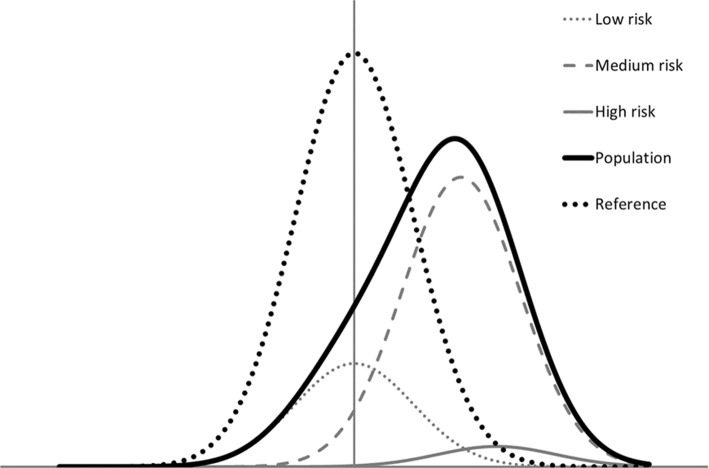
Fig. 4.
Impact of genetic variation on the liability distribution curves in example 2 (see text) with three genetic risk groups: low (risk 0.1%, prevalence 25%; dotted grey), medium (risk 10%, prevalence 70%; dashed grey) and high risk (risk 25%, prevalence 5%; solid grey curve). The solid black curve represents the liability in the overall population and the dotted black curve the reference distribution, i.e. the corresponding liability distribution in a population without this genetic variation

