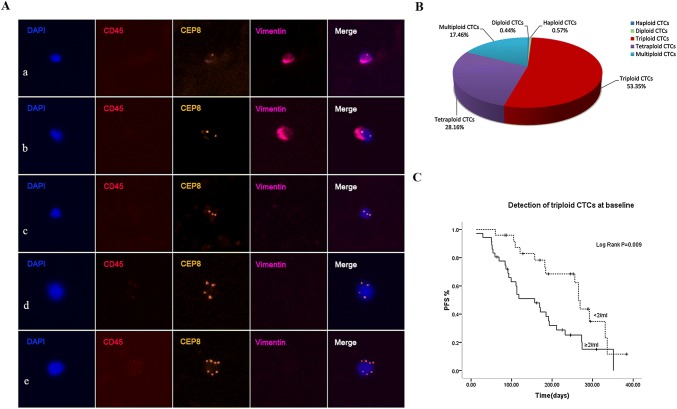
Fig. 2.
Analysis of Chr 8 ploidy of CTCs and correlation of triploid CTCs with PFS. A Images of diverse Chr8 ploidy CTCs. a Haploidy, b diploidy, c triploidy, d tetraploidy, e multiploidy copies. B Proportion of diverse Chr8 ploidy CTCs in pretreatment patients. C Correlation of triploid CTCs with PFS. Baseline triploid CTCs ≥ 2/6 ml showed a much shorter PFS than patients with triploid CTCs < 2/6 ml (p = 0.009)

