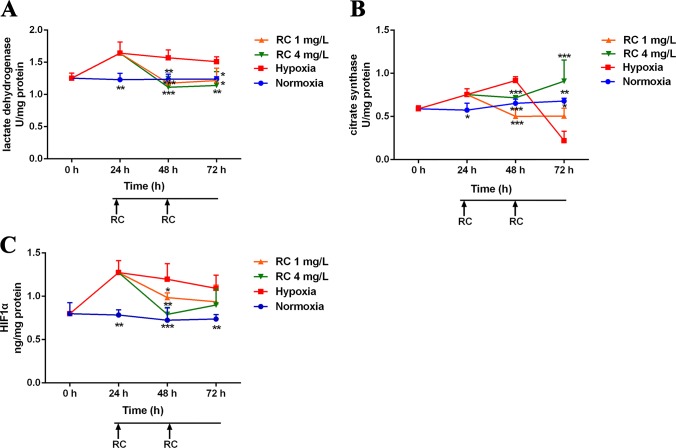
Figure 2.
The activities of hypoxic biomarkers including (A) lactate dehydrogenase, (B) citrate synthase, and (C) hypoxia-induced factor-1α in different RC extract treatment groups under hypoxia when compared to the hypoxia and the normoxia groups. *p < 0.05, **p < 0.01, and ***p < 0.001 versus the hypoxia control group. Data are presented as the mean ± SD (n = 4).

