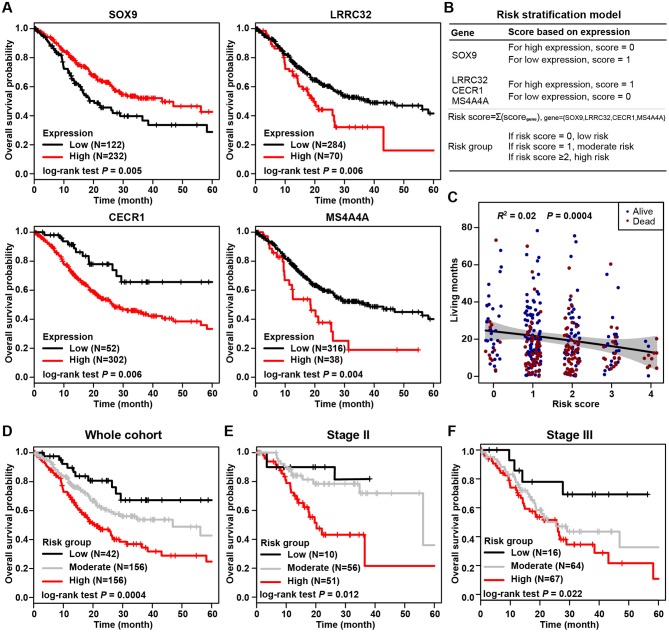
Figure 4.
Stromal-immune score-based gene signature and risk stratification model. (A) Kaplan-Meier plots of overall survival for patients grouped by expression of four signature genes, SOX9, LRRC32, CECR1, and MS4A4A. (B) Algorithm for risk stratification model based on the expression of four stromal-immune score-related signature genes. (C) Correlation between risk score and gastric cancer patient living months. (D) Kaplan-Meier plot of overall survival for all patients according to risk group. (E) Kaplan-Meier plot of overall survival for patients with stage II gastric cancer according to risk group. (F) Kaplan-Meier plot of overall survival for patients with stage III gastric cancer according to risk group.

