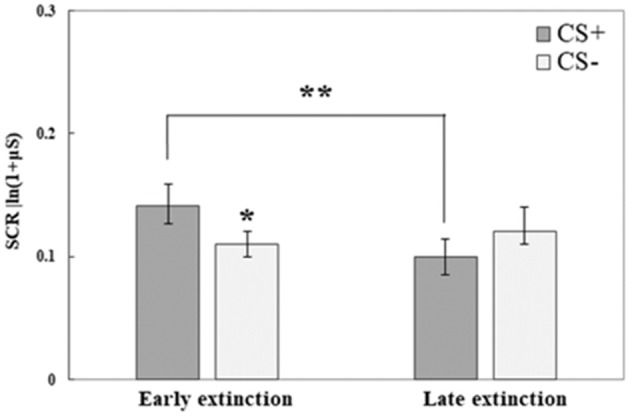
Figure 3.

Day 3: Fear extinction training took place on the third testing day. Here, both conditioned stimuli (CS+, CS−) were presented (both not reinforced) for 10 times each. This graph illustrates mean (± SEM) SCR to both stimuli at early extinction (trials 1–5) vs. late extinction (trials 6–10). The significant difference between CS+ and CS− during early extinction (*p < 0.05) indicates fear memory retrieval (early extinction CS+: RE+CORT: 0.13 ± 0.03; RE: 0.14 ± 0.03; CORT: 0.15 ± 0.04; early extinction CS−: RE+CORT: 0.12 ± 0.03; RE: 0.11 ± 0.02; CORT: 0.12 ± 0.02); the significant reduction of response to the CS+ (**p < 0.01) and the lack of difference between the stimuli at the later phase indicate successful fear extinction (late extinction CS+: RE+CORT: 0.08 ± 0.02; RE: 0.13 ± 0.03; CORT: 0.09 ± 0.02; late extinction CS−: RE+CORT: 0.09 ± 0.03; RE: 0.14 ± 0.03; CORT: 0.12 ± 0.03). As no interaction or main effect of group were found, the graph presents the groups combined (N = 74; RE+CORT group: n = 24, RE group: n = 25, CORT group: n = 25).
